Multi-scale Bio-Modeling and Visualization
CS/CAM/BME 395T - #54303
Modeling group: Models of AChR:
2BG9.PDB, AChE: 1C2B.PDB
Richard Bolkey, William Robins and Vinay Siddavanahalli
Multiple resolution grids: 323 643 1283
Multiple blobbiness: -2.3, -1.0, -0.5, -0.1
Multiple clusters: atomic, residue
Colored according to: Atoms, residues, chains, active sites
Example:
 |
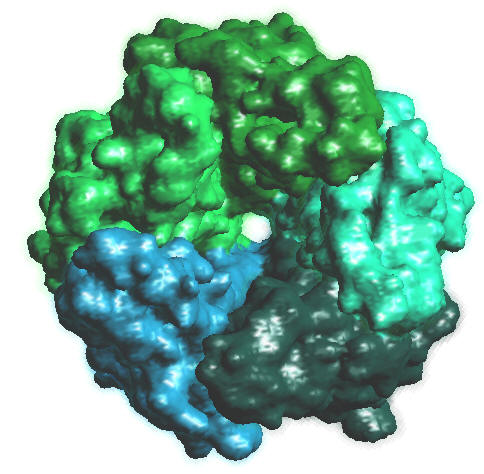 |
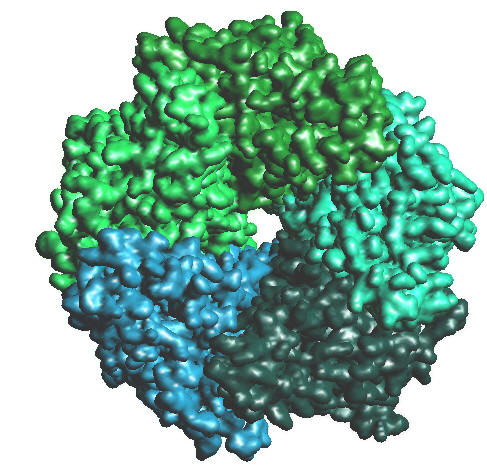
| 2BG9.PDB, Colored by chains, 128^3, B = -2.3 |
2BG9.PDB, Colored by chains, 128^3, B = -0.5 |
 |
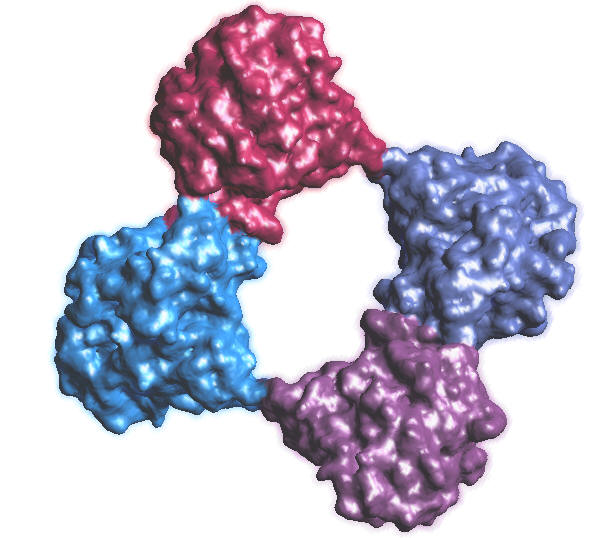 |
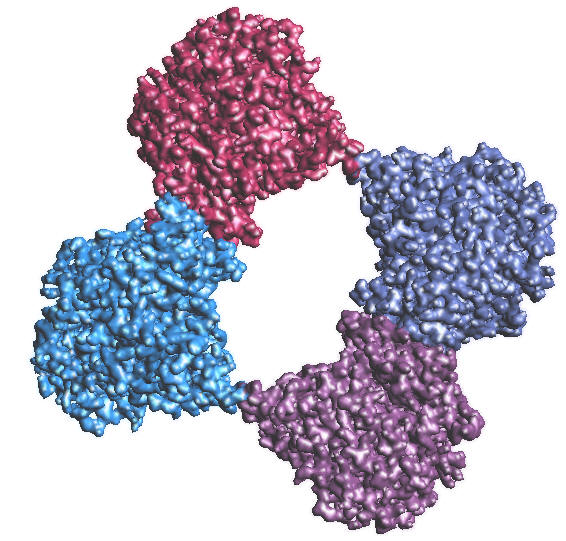
| 1C2B.PDB, Colored by proteins, 128^3, B = -2.3 |
1C2B.PDB, Colored by proteins, 128^3, B = -0.5 |
Molecule Group Requirements
We need to "devise an automatic way of placing"
the AchR and AchE in the cell membrane. According to the Project Notes, we
require a signed distance volume of the membrane, orientation of the AchR
(surface normals of the membrane), and the density of the AchR and AchE. This
will require a separate flag for the top surface and the folds on the membrane.
Each voxel in the volume should be marked with this flag along with a flags
marking containment in the membrane boundary, the volume interval around the
membrane surface, the basal lamina, and the synaptic cleft.
Our output will be the membrane with AchR and AchE distributed within/along the
membrane surface. We will tag each voxel of the membrane with a list of
molecules contained within the voxel and their positional attributes.