Note that in the "not wrapping" case, the horizontal segment on the right is part of the curve you should output, even though it looks gray (poor conversion from postscript to GIF).
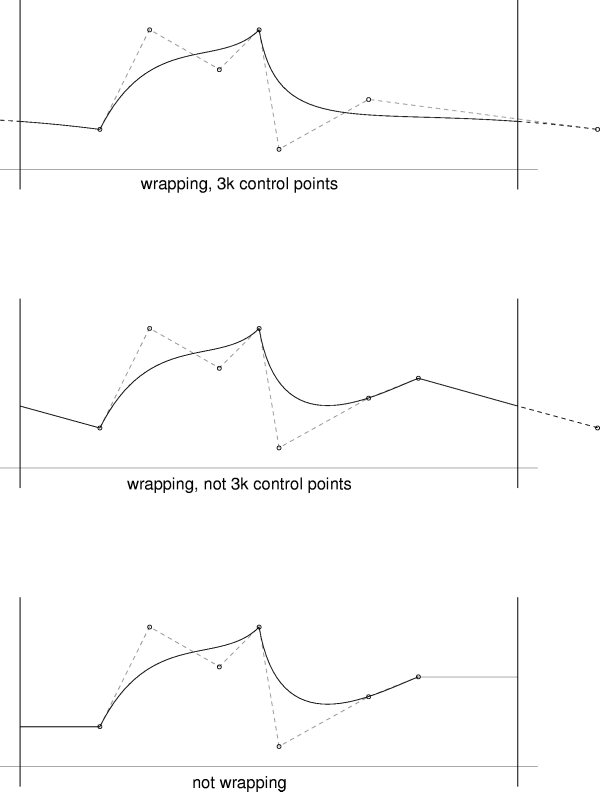
The left and right vertical lines represent xmin and xmax. Your job in each case is to output the solid curve (actually, the endpoints of line segments approximating that curve).

Note that in the "not wrapping" case, the horizontal segment on the right is part of the curve you should output, even though it looks gray (poor conversion from postscript to GIF).