You can work in groups of two. Each group should do the
assignment independently.
Late policy: Submissions can be at most 1 day late with 10%
penalty.
| Array of struct (AoS) | Struct of arrays (SoA) |
struct node_data_t {
|
class graph {
|
We will give you three graphs to run with the two algorithms and
two node data representation. Therefore, there will be 12 variants
in total, and those variants have different performance
characteristics. You will learn through this assignment the steps
to analyze the performance of the code at instruction level, at
micro-architectural level, and using cycle-related metrics. After
going through the steps, you should be able to pinpoint the
bottleneck of a code at micro-architectural level, e.g. branch
prediction unit, caches, etc.; see why the code for an input leads
to such a bottleneck; and possibly figure out a way to improve the
code.
(a) (10 points) Add a function in the code given to you to derive out-degree histogram. Add another function to get the in-degree histogram. Draw the out-degree histograms and in-degree histograms for rmat22, transposed rmat22 (rmat22_t), and roadUSA graphs. Explain the histograms briefly.
Run VTune on the orcrists for pull-style and push-style algorithms on the three graphs in part (a), where node data are represented in AoS. Run until convergence using the threshold of 10-20. Repeat the previous runs, but this time the node data are represented in SoA. During the runs, collect for the main loops (without graph construction, initialization, scaling and output) (1) runtime (by instrumenting the code), and (2) the estimated numbers for the following events (by VTune):
| Event name |
Meaning of the event |
Sample after value (SA) |
| CPU_CLK_UNHALTED.REF_P |
# unhalted CPU reference cycles |
133000 |
| CPU_CLK_UNHALTED.THREAD | # unhalted CPU thread cycles |
2000000 |
| FP_COMP_OPS_EXE.X87 | # X87 floating-point instructions |
2000000 |
| FP_COMP_OPS_EXE.MMX | # MMX floating-point instructions |
2000000 |
| FP_COMP_OPS_EXE.SSE_FP | # SSE floating-point instructions |
2000000 |
| FP_COMP_OPS_EXE.SSE2_INTEGER |
# SSE2 floating-point instructions for
typecast from integers to floating-point numbers |
2000000 |
| INST_RETIRED.ANY | # retired instructions |
2000000 |
| MEM_INST_RETIRED.LOADS | # load instructions |
2000000 |
| MEM_INST_RETIRED.STORES | # store instructions |
2000000 |
| MEM_LOAD_RETIRED.L1D_HIT | # loads and stores that hit in L1D cache |
2000000 |
| MEM_LOAD_RETIRED.L2_HIT | # loads and stores that hit in L2 cache | 200000 |
| MEM_LOAD_RETIRED.LLC_UNSHARED_HIT | # loads and stores that hit in LLC | 200000 |
| MEM_LOAD_RETIRED.LLC_MISS | # loads and stores that miss LLC | 200000 |
| MEM_LOAD_RETIRED.DTLB_MISS | # loads and stores that miss DTLB | 200000 |
| BR_MISP_EXEC.ANY | # mis-predicted branches |
20000 |
| BR_INST_EXEC.ANY | # branches | 20000 |
Now we are ready to analyze the performance of various page-rank
computations. From now on, all the numbers are for the main loops
in page-rank computation. You will be asked to generate "plots"
below - these are bar graphs, one for each of the three input
graphs. In each bar graph, there are four bars: pull-AoS,
pull-SoA, push-AoS, and push-SoA.
Let us first analyze at instruction level.
(b) (5 points) Plot the runtimes of the 12 variants. Plot the number of retired instructions for the 12 variants. Do the two plots resemble each other?
(c) (15 points) Plot the numbers of branches, loads, stores, and all floating-point operations for the 12 variants. Explain the numbers you get using the characteristics of input graphs, pull-style or push-style algorithms, CSR graph representation, and node data in SoA or AoS. Can you explain the runtime using one of the instruction types from the above?
Now let us dive into micro-architectural level.
(d) (10 points) Compute and plot the branch mis-prediction rate
(# mis-predicted branches / # branches) for the 12 variants.
Explain the numbers you get. Can you explain the runtime using
branch mis-prediction rate?
(e) (15 points) Compute and plot the cache miss rates (# cache misses / # cache accesses) of L1D, L2, and LLC for the 12 variants. Explain the numbers you get. Can you explain the runtime using cache miss rates?
(f) (20 points) Compute and plot Misses Per Kilo Instructions
(MPKI, # cache misses / # retired instructions * 1000) of each
level of data cache for the 12 variants. Explain the numbers you
get. What does MPKI of page-rank computation suggest you? (Hint:
Vectorized MMM without L1 tiling, which has abundant amount
of independent floating-point computations, can have 45 L1D MPKI
on the orcrists.) Combined with cache miss rates, where in
the micro-architecture would you expect the bottleneck of
page-rank computation to be?
Let us now verify the previous analysis with cycle-related metrics.
(g) (5 points) Compute and plot Cycles Per Instruction (CPI, # unhalted CPU thread cycles / # retired instructions). Does that match the runtime trend?
(h) (20 points) To know where the cycles go during the
computation, we can compute penalty based on some machine
parameters and collected performance numbers. Compute and plot for
the 12 variants the penalty of the following components using the
indicated formula:
| Component |
Penalty formula |
| Branch mis-predictions |
15 * # mis-predicted
branches / # unhalted CPU thread cycles |
| DTLB misses |
7 * # DTLB misses / # unhalted CPU thread cycles |
| L2 hits |
12 * # L2 hits / # unhalted CPU thread cycles |
| LLC hits |
41 * # LLC hits / # unhalted CPU thread cycles |
| LLC misses |
200 * # LLC misses / # unhalted CPU thread cycles |
Explain the penalty numbers you get. Why are some penalty numbers greater than 1? Why do penalties from all parts for a page-rank computation not sum to one? On which component does the page-rank computation spend most of the time? Does that concur with what we analyzed at micro-architectural level?
Submit in a .tar.gz to Canvas all your code and a report in PDF
format. In the report, state all your teammates clearly, and
include all the figures and explanations. Include a Makefile to
compile your program by running make [PARAMETERS]. Include
a README.txt to explain how to compile your code, how to run your
code, and what the output will be.
(1) Please use the code provided by TA.
The tarball contains the following:
(2) For deriving histogram, you can use std::map (or std::unordered_map and then sort by degree). Use log scale for both axis in your histograms. You can discard 0-degree nodes in your histogram.
(3) You can use the following VTune command for collecting all numbers (except for runtime) on the orcrists:amplxe-cl -collect-with runsa -knob event-config=\
CPU_CLK_UNHALTED.REF_P:sa=133000,\
CPU_CLK_UNHALTED.THREAD:sa=2000000,\
FP_COMP_OPS_EXE.X87:sa=2000000,\
FP_COMP_OPS_EXE.MMX:sa=2000000,\
FP_COMP_OPS_EXE.SSE_FP:sa=2000000,\
FP_COMP_OPS_EXE.SSE2_INTEGER:sa=2000000,\
INST_RETIRED.ANY:sa=2000000,\
MEM_INST_RETIRED.LOADS:sa=2000000,\
MEM_INST_RETIRED.STORES:sa=2000000,\
MEM_LOAD_RETIRED.L1D_HIT:sa=2000000,\
MEM_LOAD_RETIRED.L2_HIT:sa=200000,\
MEM_LOAD_RETIRED.LLC_UNSHARED_HIT:sa=200000,\
MEM_LOAD_RETIRED.LLC_MISS:sa=200000,\
MEM_LOAD_RETIRED.DTLB_MISS:sa=200000,\
BR_MISP_EXEC.ANY:sa=20000,\
BR_INST_EXEC.ANY:sa=20000 \
-start-paused -analyze-system -app-working-dir <working_dir> -- <command_line_for_pagerank>
Change <working_dir> and <command_line_for_pagerank>
to fit your needs when necessary.
(4) We recommend visualizing VTune results at your local machines. To do so, (i) register at https://software.intel.com/en-us/qualify-for-free-software/student, download Intel Parallel Studio, and install it on your local machine; (ii) download your VTune results from the orcrists; and (iii) open your VTune results using your local VTune.
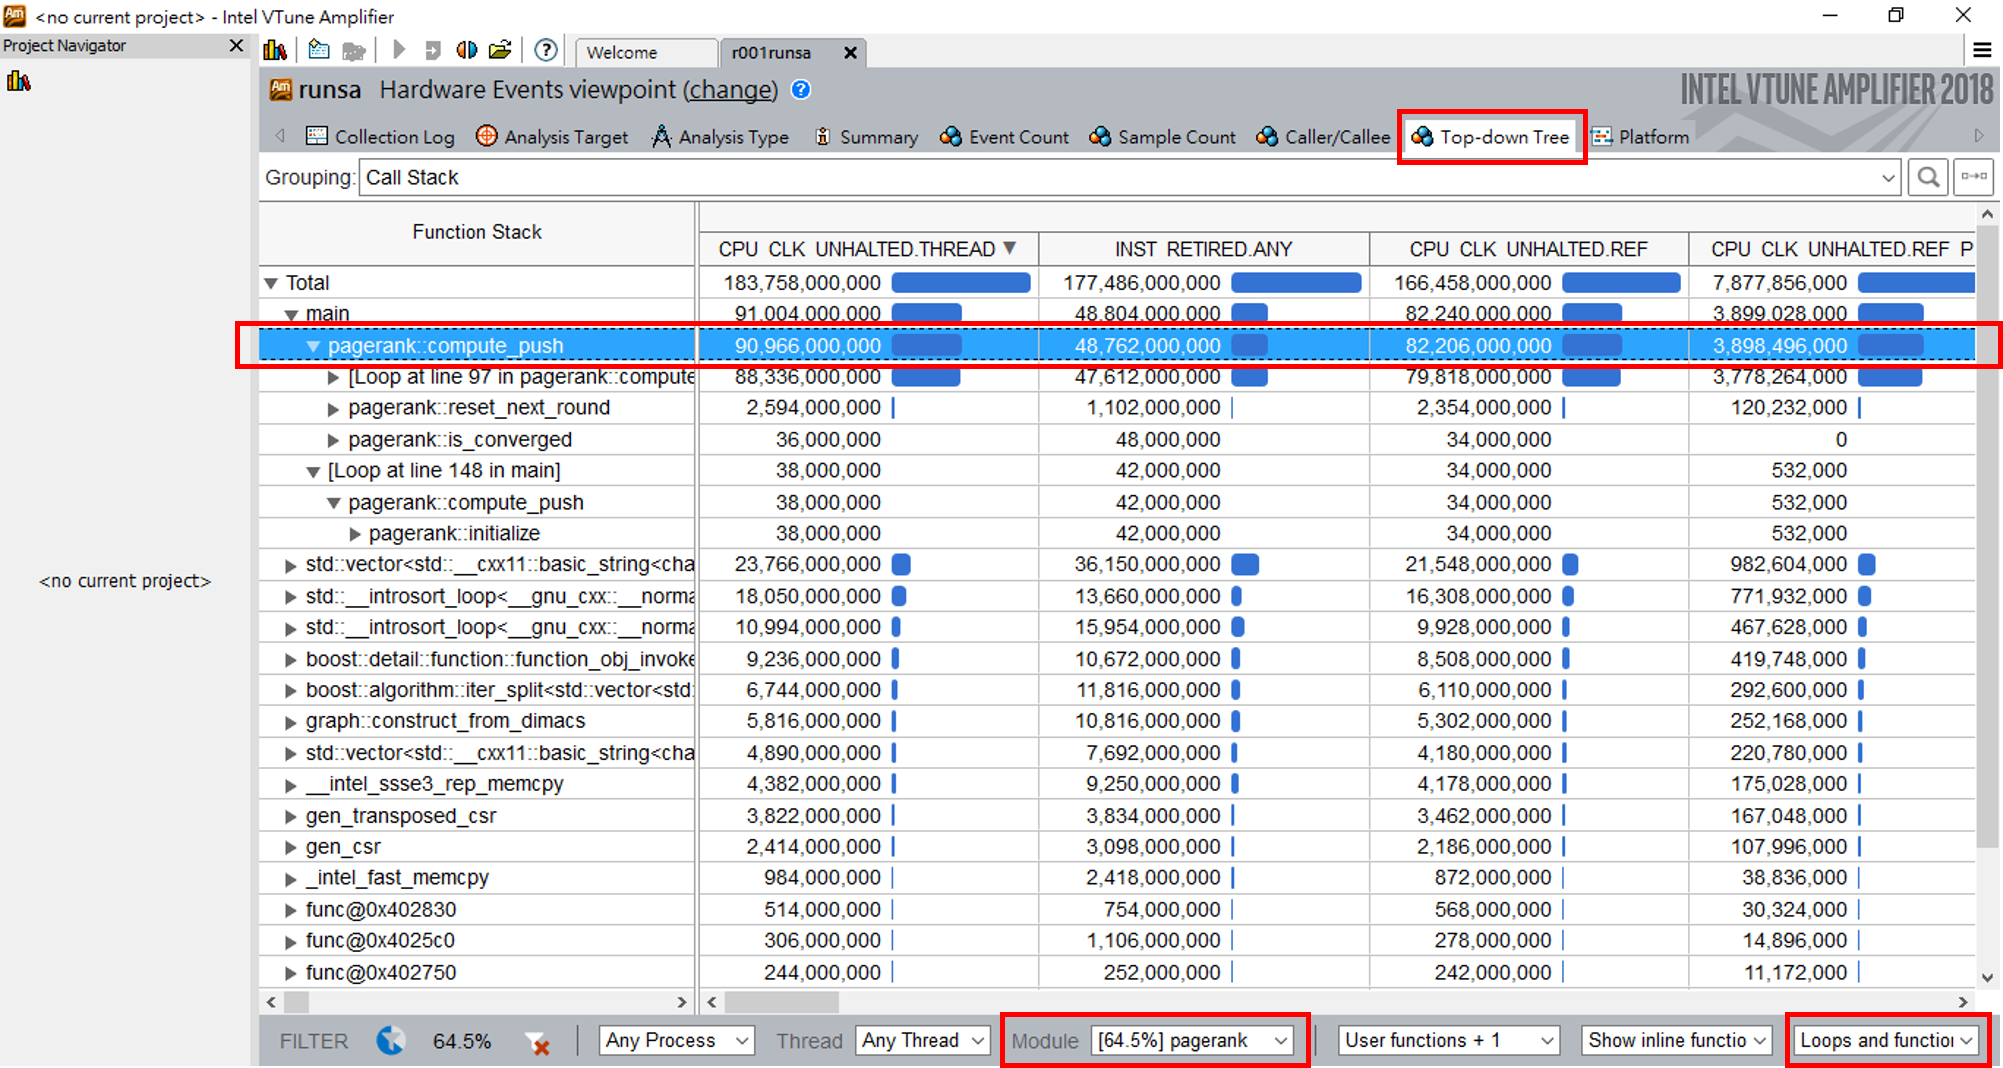
(5) We care about only performance numbers for the main loop. You
can use top-down view in VTune to get to the main loop. See the
following image for an example.