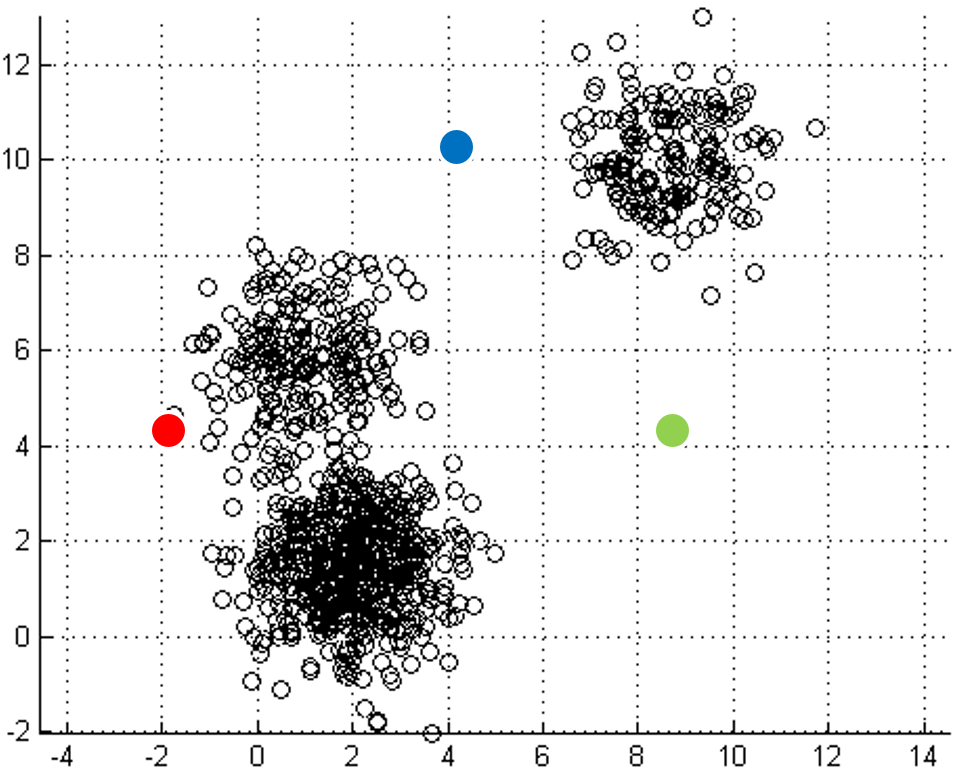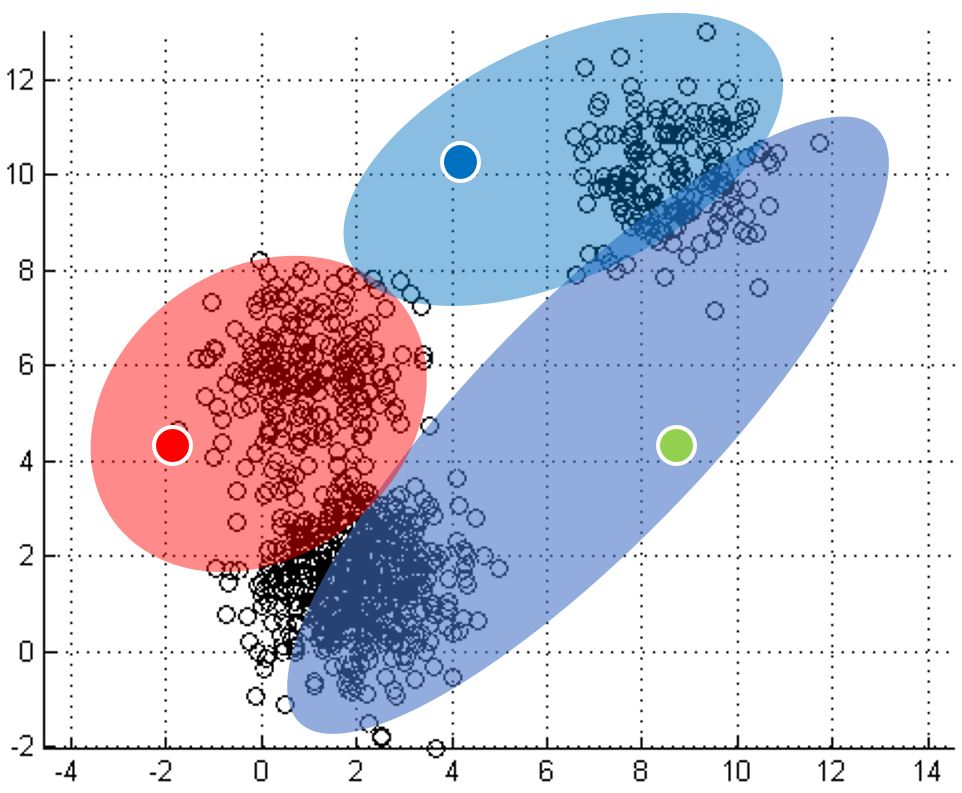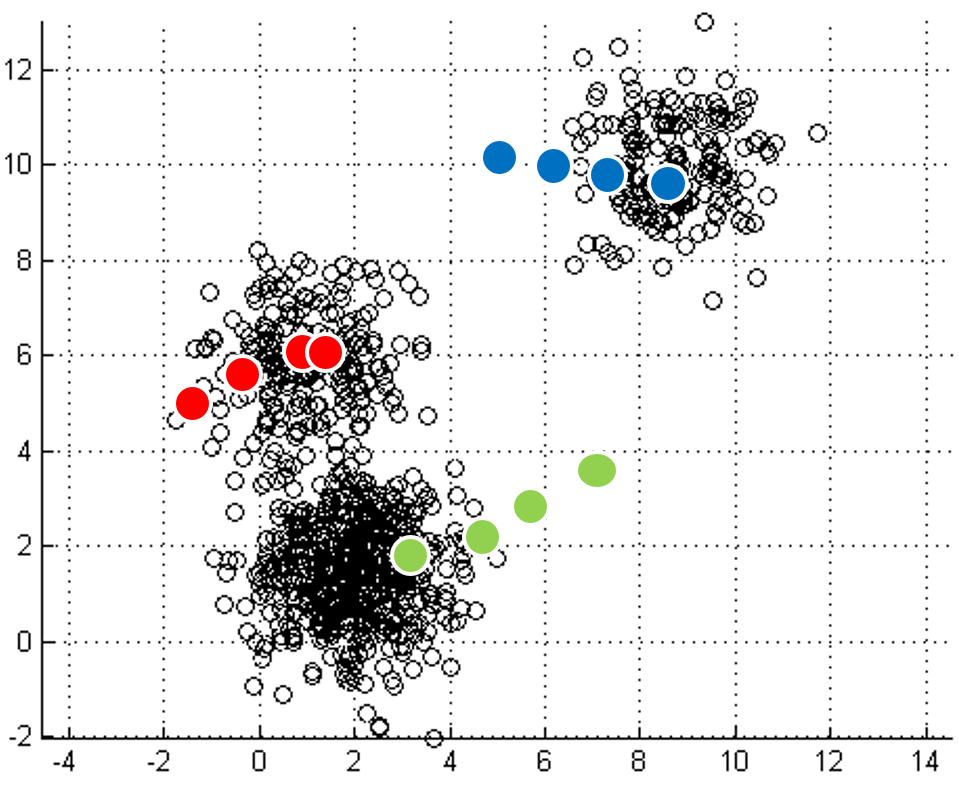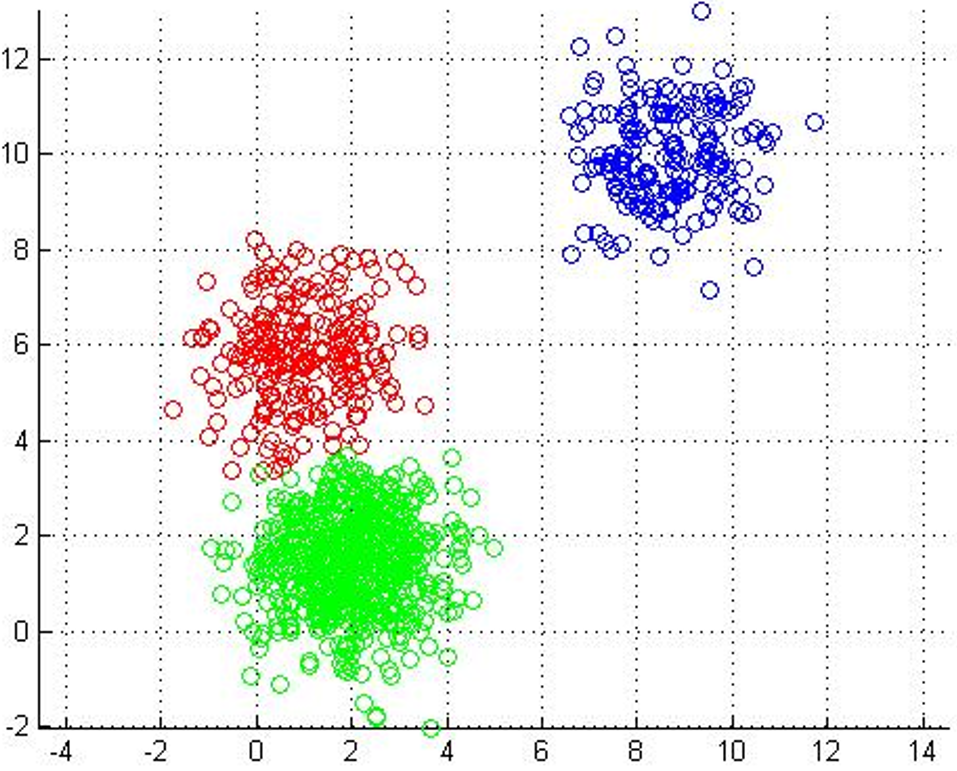


mapping to it. Iterations move
the centroids closer to their destination.
Each point labeled with its nearest centroid.
The goal of this assignment is exposure to GPU programming. You will solve the same problem you solved in Lab 1, k-means, using CUDA. Recall from lab 1, the following background about K-means:
K-Means is a machine-learning algorithm most commonly used for unsupervised learning. Suppose you have a data set where each data point has a set of features, but you don't have labels for them, so training a classifier to bin the data into classes cannot rely on supervised algorithms (e.g. Support Vector Machines, which learn hypothesis functions to predict labels given features).
One of the most straightforward things we can do with unlabeled data is to look for groups of data in our dataset which are similar: clusters. K-Means is a "clustering" algorithms. K-Means stores k centroids that define clusters. A point is considered to be in a particular cluster if it is closer to that cluster's centroid than to any other centroid. K-Means finds these centroids by alternately assigning data points to clusters based on a current version of the centroids, and then re-computing the centroids based on the current assignment of data points to clusters. The behavior the algorithm can be visualized as follows:
 |
 |
 |
 |
 |
| Initial input | Choose three random centers | Map each point to its nearest centroid | New centroid is mean of all points mapping to it. Iterations move the centroids closer to their destination. |
Centroids stop moving. Each point labeled with its nearest centroid. |
In the clustering problem, we are given a training set
x(1),...,x(m), and want to group the data into
cohesive "clusters." We are given feature vectors for each data
point x(i) encoded as floating-point vectors in D-dimensional space.
But we have no labels y(i). Our goal is to predict k centroids
and a label c(i) for each datapoint.
Here is some pseudo-code implementing k-means:
kmeans(dataSet, k) {

  // initialize centroids randomly
  numFeatures = dataSet.getNumFeatures();
  centroids = randomCentroids(numFeatures, k);

  // book-keeping
  iterations = 0;
  oldCentroids = null;

  // core algorithm
  while(!done) {

    oldCentroids = centroids;
    iterations++;

    // labels is a mapping from each point in the dataset
    // to the nearest (euclidean distance) centroid
    labels = findNearestCentroids(dataSet, centroids);

    // the new centroids are the average
    // of all the points that map to each
    // centroid
    centroids = averageLabeledCentroids(dataSet, labels, k);
    done = iterations > MAX_ITERS || converged(centroids, oldCentroids);
}
From lab 2, you should already have a single-threaded CPU-based program that accepts command-line parameters to specify the following:
--clusters:integer valued k -- the number of clusters to find--threshold:floating-point-valued threshold for convergence--iterations:integer-valued maximum number of iterations to run k-means--workers:integer-valued number of threads--input:string-valued path to an input file.Your program's output should include:
cudeEvent_t API is key to doing this accurately.
A good overview of how to do use it to measure performance can be found
here.
Using the
random-n2048-d16-c16.txt,
random-n16384-d24-c16.txt,
and
random-n65536-d32-c16.txt
sample inputs, --iterations 20, and --threshold 0.0000001,
use your implementation to find 16 centroids.
Create a graph of scalability against input size of your solution using the
Please normalize your measurements with the single-threaded solution from
Step 1.
Use CUDA shared memory to implement private partial aggregations per thread group.
Create a similar graph of scalability versus input size for your optimized solution. In this case, include bars for the fastest multi-threaded solution you measured in lab 2, labeled to in indicate the number of threads and the combination of locking primitives used to implement it.
You should use canvas to submit, along with your code,
Makefiles, and
measurements scripts, a brief writeup with the scalability graphs
requested above. Since the goal is compare the performance of
different implementations, it is fine to include all measurements on
the same graph, as long as they are well-labeled. Either way, be
sure that your writeup includes sufficient text to enable us to
understand which graphs are which.
Your writeup should additionally answer the following questions. In cases where we ask you to explain performance behavior, it is fine to speculate, but be clear whether your observations are empirical or speculation.
Handy links: