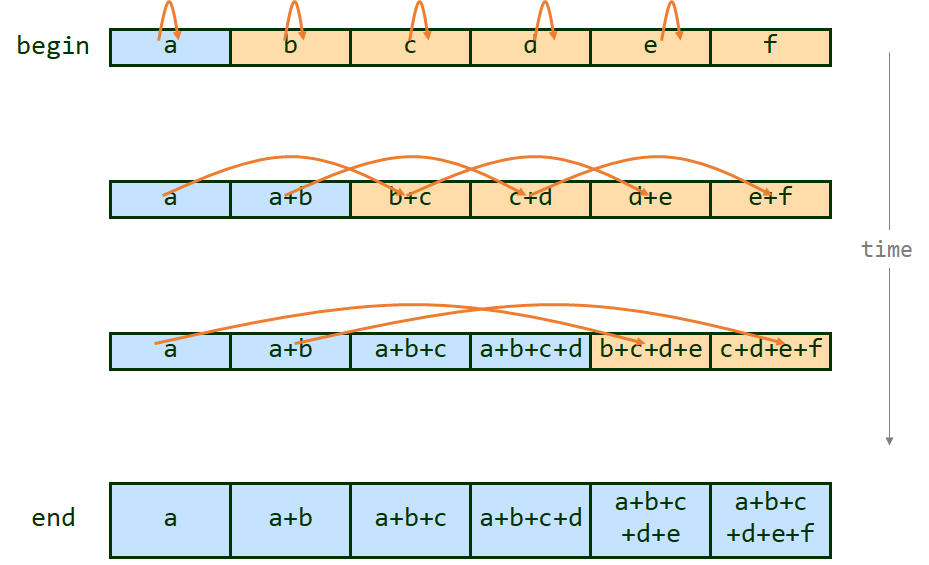
The goals of this assignment are:
In this assignment, you will implement a work-efficient parallel prefix scan algorithm using the pthreads library and a synchronization barrier you will write yourself. We encourage you to think carefully about the various corner cases that exist when implementing this algorithm, and challenge you to think about the most performant way to synchronize a parallel prefix scan depending on its input size.

Parallel prefix scan has come up a number of times so far in the course, and will come up again. It is a fundamental building block for a lot of parallel algorithms. There are good materials on it in Dr. Lin's textbook, and the treatment of it you can find on Wikipedia comes with reasonable pseudocode (see here). You may notice that prefix sum and prefix scan are in fact the same, with sum just being a single instance of the associative and commutative operator that scan requires. Note that you will be implementing a work-efficient parallel prefix scan.
The sequential version is called when the number of threads specified on the command line is 0 (-n 0). Note that
using a single pthread (-n 1) is not the same, as it involves all the overheads of thread creation and teardown that would
not be present in a truly sequential implementation.
You can always test correctness of your parallel code by comparing to the sequential version.
Recall that prefix scan requires a barrier for synchronization In this step, you will write a work-efficient parallel prefix scan using pthread barriers. For each of the provided input sets, set the number of loops of the operator to 100000 (-l 100000) and graph the execution time of your parallel implementation over a sequential prefix scan implementation as a function of the number of worker threads used. Vary from 2 to 32 threads in increments of 2. Then, explain the trends in the graph. Why do these occur?
Now that you have a working and, hopefully, efficient parallel implementation of prefix scan, try changing the amount of loops the operator does to 10 (-l 10) and plot the same graph as before. What happened and why? Vary the -l argument and find the inflexion point, where sequential and parallel elapsed times meet (does not have to be exact, just somewhat similar). Why can changing this number make the sequential version faster than the parallel? What is the most important characteristic of it that makes this happen? Argue this in a general way, as if different -l parameters were different operators, afterall, the -l parameter is just a way to quickly create an operator that does something different.
In this step you will build your own re-entrant barrier. Recall from lecture that we considered a number of implementation strategies and techniques. We recommend you base your barrier on pthread's spinlocks, but encourage you to use other techniques we discussed in this course. Regardless of your technique, answer the following questions: how is/isn't your implementation different from pthread barriers? In what scenario(s) would each implementation perform better than the other? What are the pathological cases for each? Use your barrier implementation to implement the same work-efficient parallel prefix scan. Repeat the measurements from part 2, graph them, and explain the trends in the graph. Why do these occur? What overheads cause your implementation to underperform an "ideal" speedup ratio?
How do the results from part 2 and part 3 compare? Are they in line with your expectations? Suggest some workload scenarios which would make each implementation perform worse than the other.
The first line in the input file will contain a single integer n denoting the number of lines of input in the remainder of the input file. The following n lines will each contain a single integer/
The required inputs and a simple one can be generated by running the generate_input.py python script, but you are free to create your own tests for debugging purposes.
You shouldn't change the Makefile since our grading script will assume the binary is built at a specific place and name. Your solution should output the execution time in seconds to stdout, and no other output. It is fine to produce other output on stdout as long as it is disabled by default, either at compile time (using macros) or at runtime (using an extra/optional command-line flag).
When you submit your solution, you should include the following file in a tarball:
Please report how much time you spent on the lab.