Review the assignment guidelines.
In this assignment you will complete 4 functions in a program that perform transformations to a given list of lists of integers that represents a digital image.
Start with the provided images.py program. Complete the header section and the following four functions described below. Add other functions as necessary to provide structure and remove redundancy.
Recall from the first lecture how I said in most computer systems all data is stored as numbers. Those numbers are given different meaning based on the encoding scheme used, for example ASCII or Unicode for text.
The same is true for digital images and there are many, many different encoding schemes. https://xkcd.com/927/
Among the simplest are a series of encoding schemes and file formats under the Netpbm project. The formats are extremely simple, but are not actually used much in practice as there are other approaches that use far, far less memory when storing the data in a file or transmitting the information over a computer network.
This assignment deals with the plain (or ASCII) pgm file format. PGM stands for Portable Graymap. The PGM file format is explained at this web page.
Here is a very simple, very small example:
P2
# Image of an H.
6 9
15
0 0 0 0 0 0
0 15 0 0 15 0
0 15 0 0 15 0
0 15 0 0 15 0
0 15 15 15 15 0
0 15 0 0 15 0
0 15 0 0 15 0
0 15 0 0 15 0
0 0 0 0 0 0
It is not required that the columns line up as shown. That was added for readability of this example.
A 6 x 9 pixel image would be tiny on most modern displays.
The code to read and write pgm files is provided in the images.py program.
Regardless of the image format, the majority of image processing programs work with the image as an image raster. The image is represented as a matrix (a list of lists in Python) where each element is a pixel and the color of that pixel is stored as a number. In this assignment we will only work with grey scale images that require a single number to represent a color. Color images often represent the color of a pixel with three numbers, the amount of red, green, and blue (RGB) in the pixel varying from 0 (none) to some maximum value (typically, but not always 255).
Once we have the list of list of ints we can alter then image by changing those numbers. Filters or transformations of images follow some set algorithm for altering the color values. On this assignment you will implement four functions, each one representing a different filter or transformation.
Each function creates and returns a new list of lists of ints the same size as the raster passed into the function. The original raster is not altered by these functions.
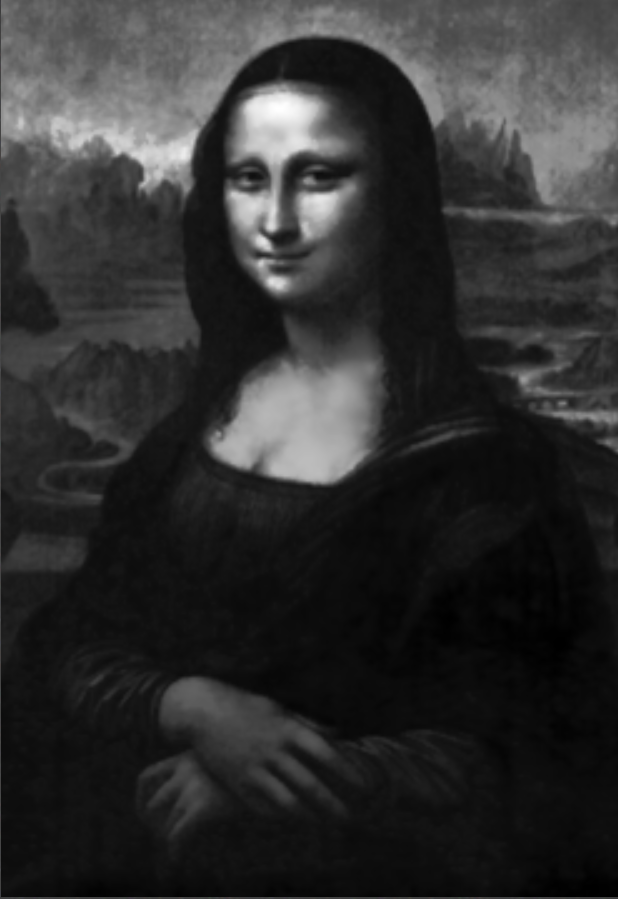
Consider this image of the Mona Lisa. (The actual pgm file is here.)

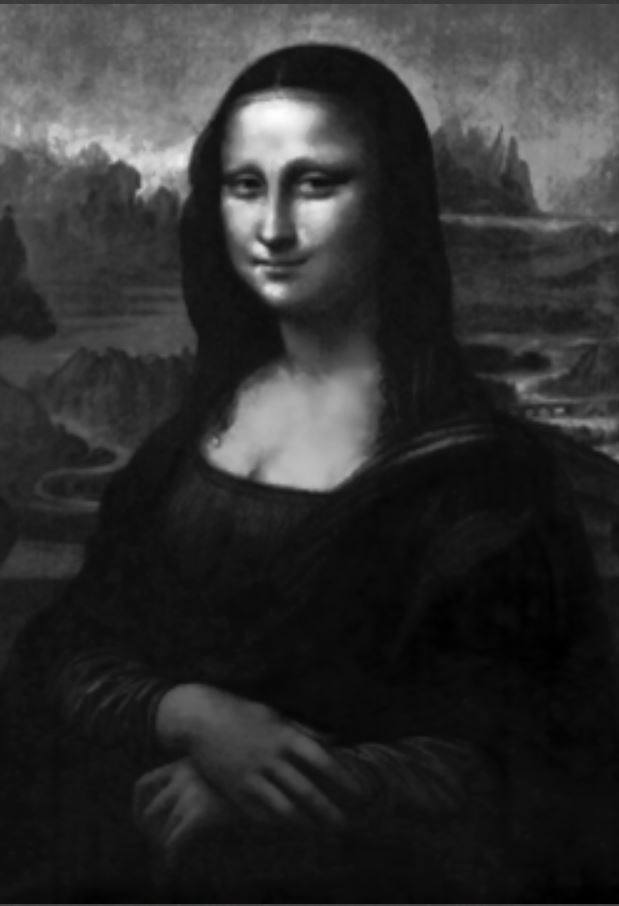
1. The first function / filter is inverting the colors of the image. This means creating a new raster, but each element is equal to the max grey value - the original value. Here is the result of applying this filter to the Mona Lisa:

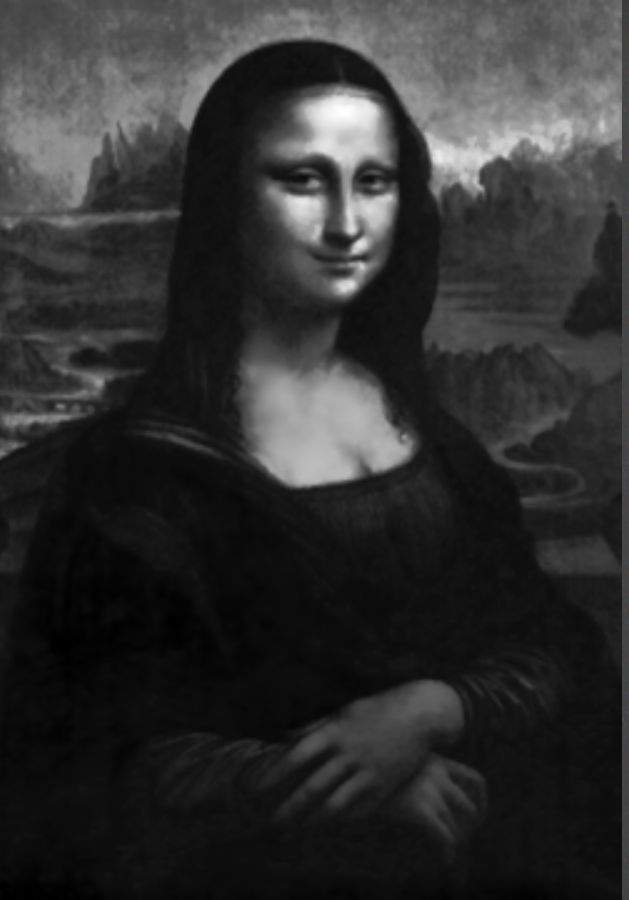
2. The second function is creating a mirror image of the original raster. Essentially the order of the values in each row are reversed.
Here is the result of applying this filter to the Mona Lisa:

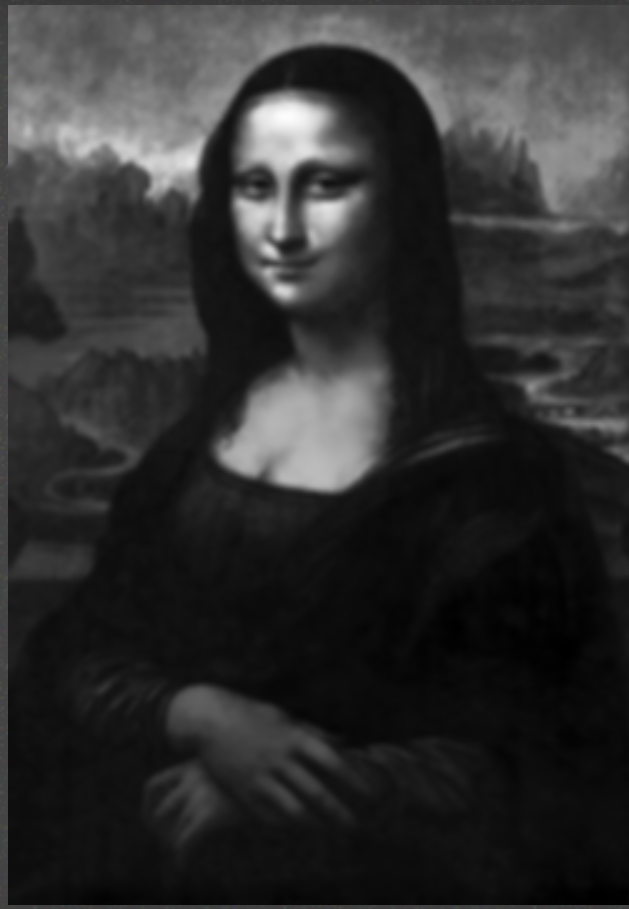
3. The third filter is a blur or softening. This is a neighborhood filter where the value of each pixel is altered to the average (truncated integer) of the pixels neighboring it. In general each pixel has 8 neighbors, the pixels above, below, left, right, and diagonal to it. There are special cases with the corner pixels (3 neighbors) and edge pixels not on the corner (5 neighbors.) This algorithm is very similar to the Game of Life example from the list of lists lecture.
For example if we had the pixel below with a value of 5 and the neighbors shown:
10 0 17
3 5 19
0 12 22
The sum of the values in the neighborhood, including the cell
itself, is 10 + 0 + 17 + 3 + 5
+ 19 + 0 + 12 + 22 = 88. The average is 88 / 9 = 9.777... This value would be
truncated (using the int function) to 9.
Here is the result of applying this filter to the Mona Lisa:

4. The final filter is a brightening or washout filter. The value of each pixel in the transformed image is the maximum of the pixels in the neighborhood around it. The pixel itself could be the maximum value and actually be unchanged. The neighborhood is the same as in the blur filter described above.
Here is the result of applying this filter to the Mona Lisa:

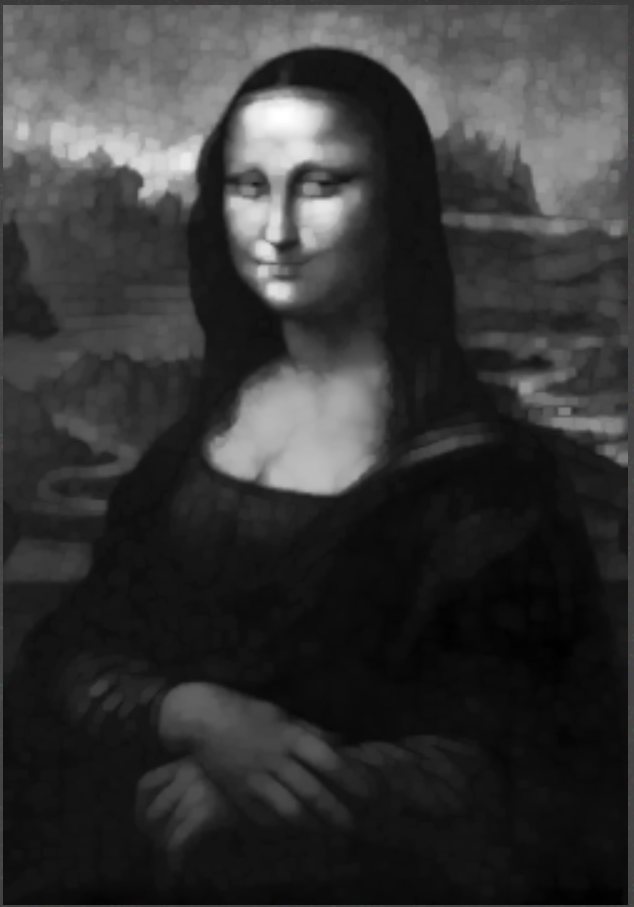
Here is a file with multiple runs of the program. Given the same inputs your output shall match this exactly.
Here are the image files used in the examples. They are all rather small for testing purposes:
The program produces an output file which you may view user the tools described below.
I strongly recommend you check your output and the expected output with a diff program such as https://www.diffchecker.com/.
If you want to work with bigger files here are two somewhat larger images in addition to the Mona Lisa:
These larger files are from this website which has more examples: https://people.sc.fsu.edu/~jburkardt/data/pgmb/pgmb.html
Although you do not have to work with the image files directly, if you want to you can with some graphics programs. I use GIMP. Another option the creators of the original assignment mention (that I have not used) is Irfanview.
There is also a web based viewer for images stored in the PGM format. You simply have to drag the file into the web page. http://paulcuth.me.uk/netpbm-viewer/