Placed Online: Friday, September 27
Due: Monday, October 15, no later than 11 pm
Points: 75, about 7.5% of the final grade
Starter Files: HeatMap.java. (Complete
the header at the top of the program.)
You will also need these files (SimpleStockData.java,
StockData.java,
StockDataForMethodInfo.java,
Stocks.java,
stocks_symbols.txt,
data_fields.txt,
company_names_and_symbols.txt,
and sample_stock_data.txt.)
It is much easier to download this zip file (HeatMapFiles.zip) with ALL the
required files. Download it to you computer. If working in Eclipse you can
create a new project then add all the files in the zip to your project without
having to unzip by selecting the project in Eclipse -> select the File
menu -> select Import -> expand the General folder -> select
Archive File -> browse to the location of the zip -> click Open ->
click finish. All the source code and text files will be added to your project.
Pair Assignment. You may work with one other person on this assignment using the pair programming technique. Review this paper on pair programming. You are not required to work in a pair on the assignment. (You may complete it by yourself if you wish.) If you begin working with one partner and do not wish to finish the assignment with that partner you must complete the assignment individually. If you work with a partner, the intent is that you work together, at the same computer. One person "drives" (does the typing and explains what they are doing) and the other person "navigates" (watches and asks questions when something is unclear). You should not partition the work, work on your own, and then put things together.
You and your partner may not acquire from any source (e.g. another student or an internet site) a partial or complete solution to a problem or project that has been assigned. You and your partner may not show other students your solution to an assignment. You may not have another person (current student other than your partner, former student, tutor, friend, anyone) “walk you through” how to solve an assignment. You may get help from the instructional staff and use code from class.
Description: The purpose of this assignment is to use the Java2D graphics library to show a visualization of stock market data. We will use the stocks from the Dow Jones Industrial Average. You will create a Heat Map for the stocks in the Dow based on various fundamental values for each stock. You can see a sample of a Heat Map of the S&P 500 that uses price change for the day at this page.
The fundamental values for the Stocks we will use are the price change for the day as a percentage, the difference in the volume (number of shares bought and sold) from the average volume as a percentage, the stock price to earnings ratio (P/E), the market capitalization (value of the company based on stock price) in billions of dollars, anslecd the dividend yield as a percentage.
All of the code that obtains the stock data and determine the various values is already completed. You will interact with a few of the classes.
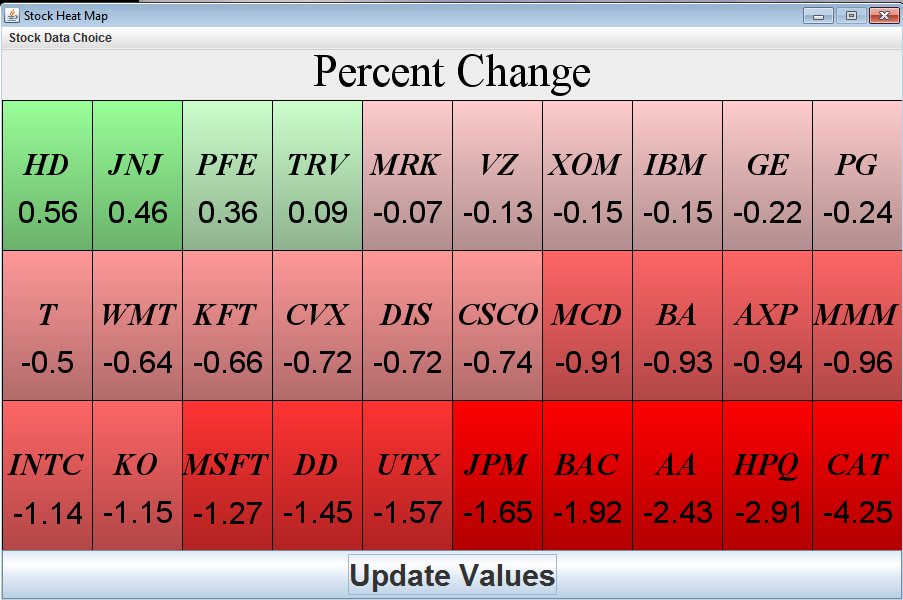
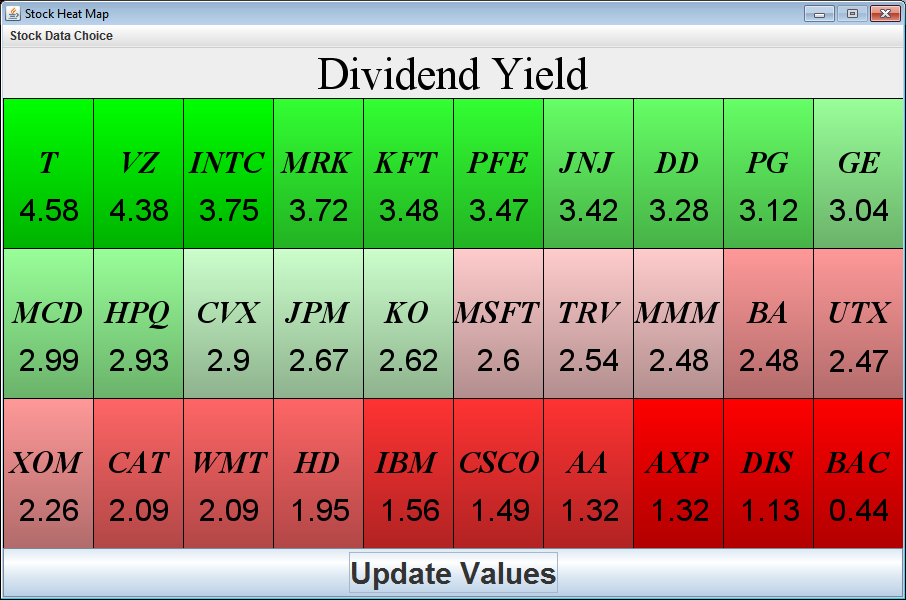
Here are the expected Heat Maps using the data hard coded in the sample_stock_data.txt file. A boolean in the main method of HeatMap.java is used to display data from a local file or to obtain the data from the web. If the Update Values button is pressed the program does to the web to obtain the latest data from Yahoo Finance. (Delayed 15 minuets or so.) It is already complete but information on how the data is obtained from the web can be found on this web page and this one.
Much of the GUI has already been completed. The frame, button, and menu have already been created and the event listeners have been created and connected.
Complete the HeatMapPanel class which draws the large title in black at the top and draws the 30 cells with the stock symbols and data. The properties of the panel are:
The large title drawn in Black with the logical SERIF Font using the PLAIN style. The size will vary based on the amount of space set aside for the LABEL_HEIGHT. The String that is drawn is sent to the panel via the HeatMapPanel.SetStockData(String) method. The String sent as the parameter is the String to draw. The String must be approximately centered vertically and horizontally in the top portion of the panel.
Each cell contains a stock symbol and a data value. The stock symbol and data are obtained by accessing elements of currentStockData instance variable and calling the getSymbol() (returns a String) and getFundamentalData() (returns a double) methods.
The stock symbol is drawn with its baseline on the horizontal line that cuts the cell in half. The symbol is drawn using a SERIF font that is BOLD and ITALIC.
The data is drawn in the bottom half of the cell and is approximately centered vertically and horizontally. The data is drawn using a SANS_SERIF font with PLAIN style.
Each cell is outlined with a black rectangle.
There are 10 colors for the heat map. The 5 good colors start
with
green, the best, (0,255,0) and move down in steps to a pale green color (204.
153, 204). The 5 bad colors start with red (255, 0, 0) and move up to a pale red
color (255, 204, 204).
The actual paint used on the Graphics object is a
gradient paint. (The Apple effect). The top, brighter color of the gradient is
the base color as already described. The bottom, darker color of the gradient is
obtained by taking the top color and calling the Color.darker() method. For
example Color bottomColor = topColor.darker();
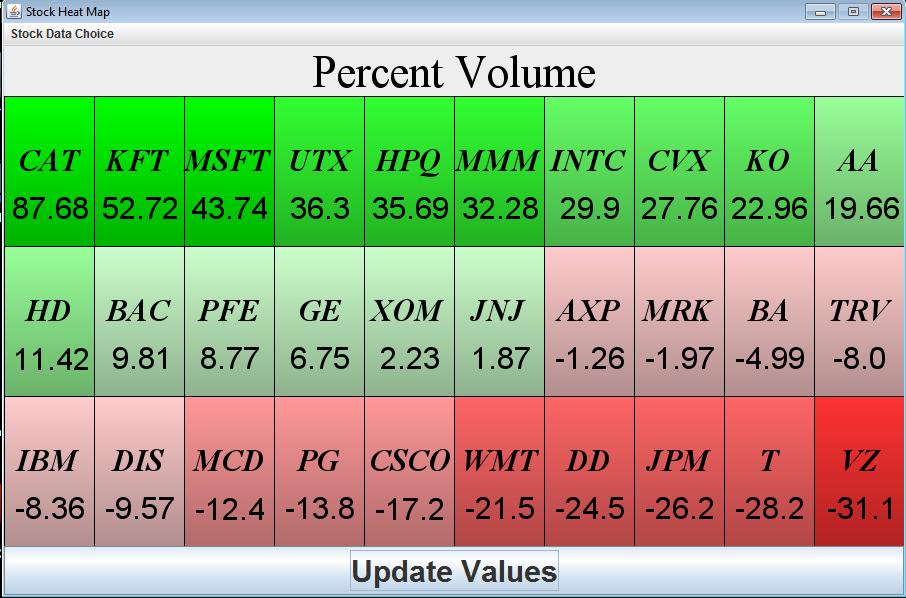
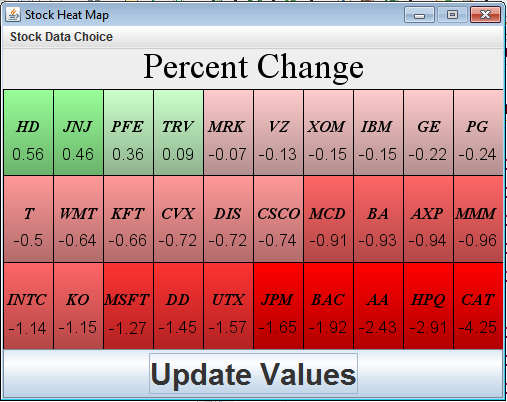
When the Percent Change and Percent Volume data fields are
shown, the scale is an absolute scale. This means the color of a cell depends on
where the data value falls in an an absolute range. There are no set number of
colors for each cell. On a good day for the stock market, they may all be bright
green. On a bad day they may all be bright red.
For the Percent Change the range is +2.0 to -2.0. Any values above 2.0 are
treated as if they are 2.0 and any values below -2.0 are treated as if they are
-2.0. The range is split evenly between the 10 colors. So 2.0 - 1.6 is the
brightest green, 1.6 - 1.2 are the next brightest green, and so forth.
For the Percent Volume the range is +50 to -50.
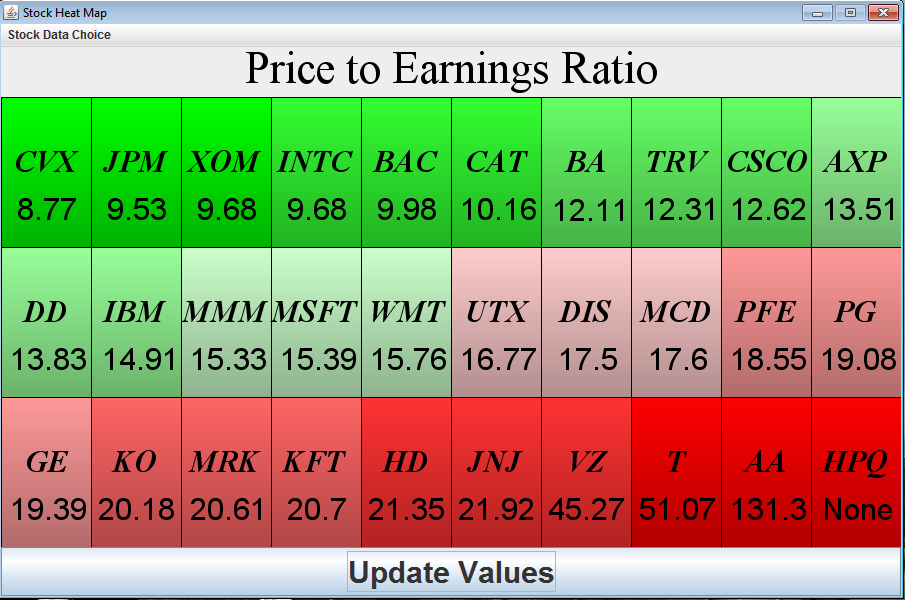
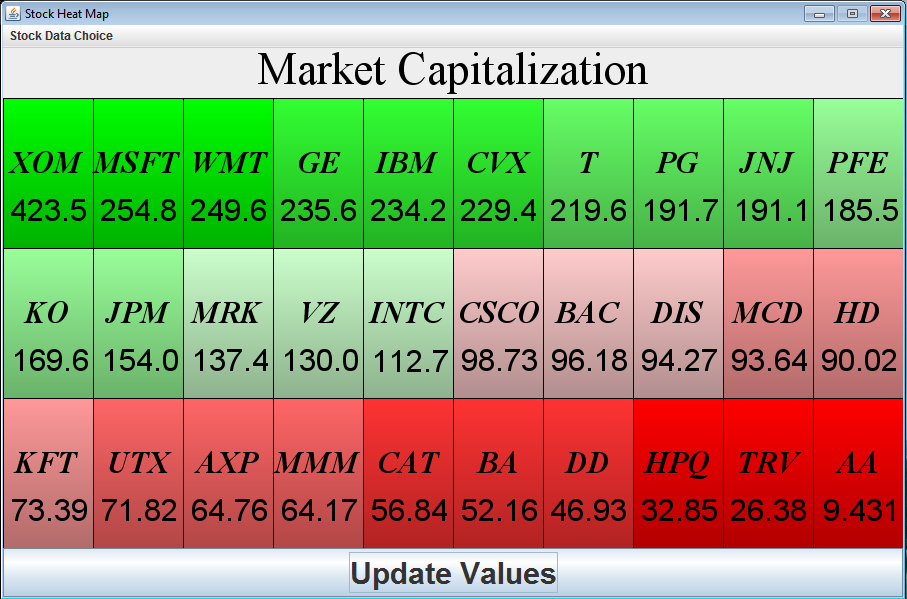
When the one of the other three fields is used the colors are relative. Every color appears three times with the top three stocks being the brightest green, the next three the next brightest green and so forth.
Avoid hard coding numbers. Use the constants WIDTH (initially
900 pixels), HEIGHT (initially 500 pixels), and LABEL_HEIGHT (initially 50
pixels). If those constants are changed the resulting GUI must be correct. For
example, when I change WIDTH to 500, height to 300, and LABEL_HEIGHT to 40 and
make no other changes to the program I get the following GUI when the program is
run.
Tips:
Start early.
Develop the program in stages. Work on just drawing the black outlines of all the rectangles. Then try filling in with 3 of each color. Then add the gradient effect. Then start filling in data. Then alter the color of the cell based on the data. Adjust fonts and work on centering.
There is a special case for data values. Some data values may be a double equal to the constant StockData.NA_Field. The P/E ratio for HPQ (Hewlett-Packard) is one example. If data is equal to that special flag value, replace it in the display with the String "None".
Don't hard code values. Use local or class constants as appropriate to make the code more readable and easier to change.
For things that don't change compute the values when the HeatMapPanel constructor is called and store the results as instance variables. The cell rectangles and the 10 base colors are good candidates for this. You may find others.
Center text using the example from class and posted to the class discussion group. Centering in a cell or at the top of the panel is slightly different than centering in the overall panel, but the approach is similar.
Don't hard code the various font sizes. It makes it very hard to change the program to a different sized GUI. You can can use the GlyphVector class you used for centering to determine what is the largest possible font that allows the symbol and data to fit. Use a single font for all the symbols and a different (single) font for the data.
Use good style. Break large methods up into smaller methods for modularity and readability. Any method longer than 25 lines of code should be broken up into smaller methods. Use good variable names. Don't re-perform calculations unnecessarily that don't change. Instead perform the calculations once and store the answers. Avoid hard coding numbers. Those values have some meaning so create a local or class constant and store the value there. Then use the constant. For example 10 can be very confusing, but NUM_COLORS is more meaningful. We are grading for correctness and style. Your program may produce the required GUI, but that doe not guarantee a perfect score. You may be off by a few pixels and have minor differences in how your GUI looks. By minor I mean something that is not noticeable unless using a zoom tool. With a quick glance, the GUIs must look the same.
Fill in the header at the top of your program. When you complete the assignment turn in your HeatMap.java file which will include all your source code, using the turnin program. This page contains instructions for using turnin. Be sure you upload the file to your CS324e folder.