Project 2: Text Visualization
This project explores visualization of a book using Processing. You will choose a novel from Project Gutenberg and write programs to extract, analyze, and visualize data about the text.
Basic Requirements #
Book Text #
Choose an English-language book from
Project Gutenberg and download
it as a plain text file. Strip out all the preface information (e.g. copyright,
blurbs, word to the readers, etc). You can do this step manually in a text
editor. Place the result in a file called source.txt in your project
directory.
Information Extractors #
Write a program which generates three files by reading source.txt. Unlike most
programs in this class, you may write this program in any language you choose.
If you choose to write it in something aside from Python or Processing, make
to include language installation instructions in your project report.
(I recommend writing this script in Python, as Python has several utilities which make this more straightforward than it would be in Java).
The three files your program should output are:
-
allwords.txt
This file should contain every word in the book, each on its own line. Strip out all non-alphabetic characters, and lowercase all letters. This will include duplicate words.
-
uniquewords.txt
This text file will contain every unique word in the book, that is every word that appears exactly once. If a word appears more than once in the book, it should not appear in this file.
The simplest way to do this is to use a dictionary to count the number of occurrences of each word, and then write out the words that only appear once. If your language has a dictionary with default values like Python’s
defaultdict, I suggest you use it for making counts of words. -
wordcounts.txt
This text file will map the frequency of words to the number of words with that frequency.
Word frequency is the number of times a word appears. For example, words like “the” and “and” will have high frequencies, while words like “carboxamide” tend to have lower frequencies.
The format of this file will be lines with the form:
frequency: number of distinct words with that frequencyFor example, if we have 7000 words that appear exactly once in the text, and 50 words that appear 100 times, we would have:
1: 7000
100: 50
This data should be listed in increasing frequency value (the number before the colon increases as you move down the file).
Visualization #
Implement both of the following visualizations in Processing. Document how to switch between them in your project report. The simplest way will be to do something like what we did for the image manipulation project.
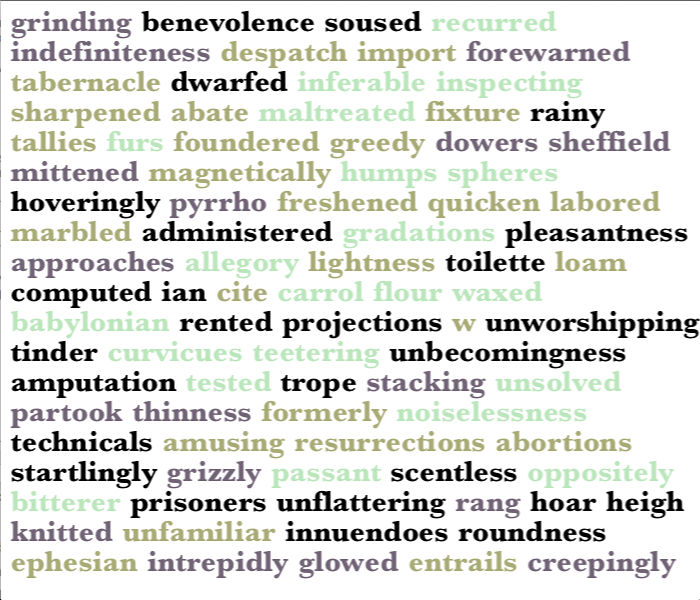
Word Visulization #
Write a program in Processing that displays a uniform word cloud based on
uniquewords.txt on an 800x600 canvas.
Choose a font, a font size, and three different colors. On running the sketch, or if the user clicks on the canvas, the program should display a random selection of words from your document. The words should have consistent spacing and should neither overlap themselves nor run off the edge of the canvas.
Explain your choice of font, font size, and colors in your project report. Words should be colored in some meaningful fashion (do not randomly choose word colors).
An example visualization, generated from Moby Dick:
Word Frequency Visualization #
Visualize the frequency between the word frequency and the number of words
with that frequency using wordcounts.txt. Your visualization is up to you,
but it should capture the connection between these two properties in a text.
Choices include your own line graph, your own scatterplot, or some stacked barplot variant. Or implement something more interesting (perhaps even something that moves)!
Project Report #
Create a project report as specified in the Project Report rules
Language Model Log #
You should either submit a log of your language model interactions, or a statement that you did not use LMs for this project. In either case, you will need to submit a file in your project on your LLM usage. See the rules on language model logs for details.
Extra Credit #
tf-idf Analysis (4 points) #
The tf-idf (term frequency-inverse document frequency) is a measure of how important a word is to a document in a collection. It is very often used in text-based recommender systems and search engines.
In order for you to compute this term meaningfully, you will need multiple
documents. Download 10 books from Project Gutenberg, naming them ec_source0.txt
through ec_source9.txt (you do not need to strip out prefaces like we did in
the main part of the project).
Write a script, in a language of your choice, which computes the tf-idf of all
words found in ec_source0.txt. Display this in a format of your choice: the
simplest way is to dump a text file with a term and its tf-idf score on each
line.
Word Cloud Visualization (up to 8 points) #
Create a word cloud visualization where the size of the words is proportional to the frequency of the words. Your visualization should have relatively few gaps between the words (that is, there should be no significant whitespace) and the words should be colored in a meaningful way.
Basic word clouds have all the words the same size. Your extra credit word cloud should have, at the very least, words of differing sizes, proportional to their frequency in the text. More extra credit will be awarded (up to the point cap) for more difficult visualizations such as having words rotated, or in different fonts.
Submission #
Your submission should include the following:
- A Processing file named
youreid_project2.pdethat performs the visualizations specified above. - Your script for preprocessing the text, written in your language of choice.
- The input file for your script
source.txt, as well as the output filesallwords.txt,uniquewords.txt, andwordcounts.txt. - Your project report
- Your language model log
Place this all into a directory named youreid_project2, zip the directory,
and submit it to Canvas.