 |
|---|
Assignment 3: Novel Visualization
|
Assignment 3: Novel Visualization
|
extract_words.py
This script will open the novel text file and generate a list containing all words in the novel (there will be duplicates). These words will be converted to lower case and have any non-alphabetic characters removed (no punctuation or numeric digits). I recommend using regular expressions to make this task easier. Consider using the regular expression findall and provide the pattern '[a-z]+' to extract only alphabetic characters (this assumes the text has already been converted to lower case).
Teams will then use this list of words to generate several text files described below:
allwords.txt
This text file will contain every word in the novel in lower case without punctuation. Each word will be placed on its own line in the text file. This will include duplicate words.
uniquewords.txt
This text file will contain every unique word in the novel. For our purposes, that is every word that appears only once in the novel. To do this, you will need to count occurrences of all words that appear in the novel. Any word that has an occurrence of 1 will be added to the text file on its own line.
I recommend using a defaultdict to help do this. Default dictionaries will automatically add new key/value pair when a new key is used. In this case, you might create a defaultdict where the key is the word itself (a string) and the value is the number of times it's been seen (an int). The value would then increment as the list of all words is traversed.
wordfrequency.txt
This text file will map frequency of words to the number of words with that frequency. Word frequency is the number of occurrences for a given word in a body of text. For example, we would expect words like "a" and "the" to have higher frequencies than context-specific words like "proletariat" or "cosmosphere."
The format of the each line in this file will be:
frequency: number of words with that frequency
For example, if there are 7000 words that appear once in the text, and 50 words that appear 20 times in the text, we would record that as:
1: 7000
20: 50
This data should be sorted based on frequency in increasing values. Note that a defaultdict can also help with the frequency counting (frequency is key, number of words with that frequency is value).
Online Word Cloud
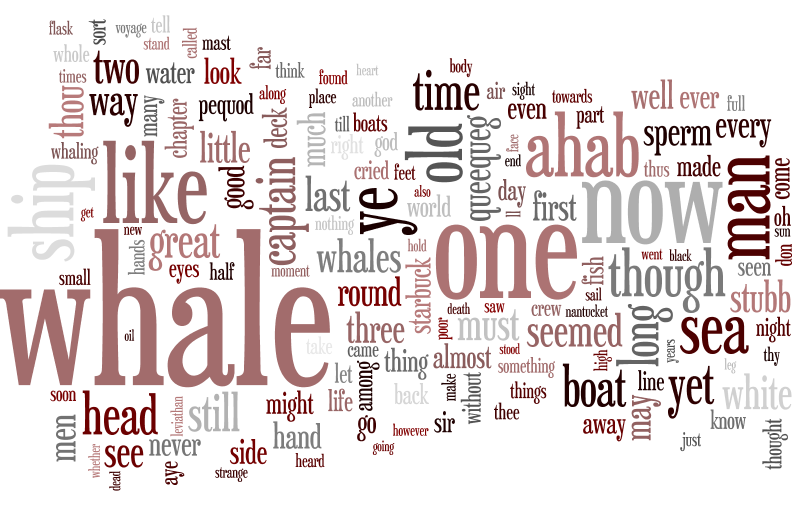
Groups will take their allwords.txt file and use it to generate a word cloud on Word Clouds. Groups are encouraged to play with the color and font settings in order to explore concepts of typography. Once the group is satisfied with the word cloud's appearance, they will save it as novelname_wordcloud.png for submission with their project. Note that if your browser has issues downloading the image using the program's save feature, you can take a screen shot of the word cloud and use that as your png.
An example using Moby Dick might look like this:

DisplayUniqueWords
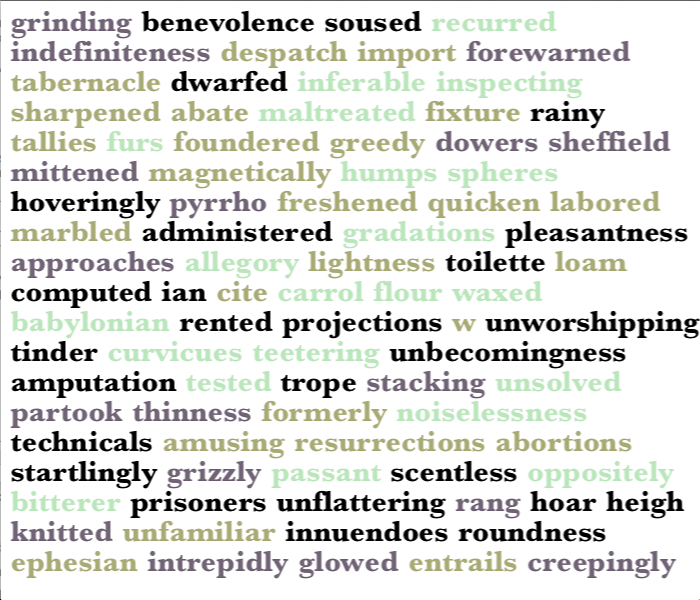
This MonoGame function will generate a word cloud based on the contents of uniquewords.txt. This word cloud will a 700x600 canvas and contain as many of the unique words that can fit legibly within this space.
Your group will pick a font, a font size and a set of 3 colors to customize the word cloud. Upon running this file, Processing will display a random selection of unique words (using Processing's random() function). These words will have a consistent spacing between them and will not run over the edge of the canvas in terms of either width or height.
You will explain your choices of font, font size and font colors (why are certain words certain colors?) in the documentation. Upon clicking the canvas, a new selection of random, unique words will replace the previous. An example from Moby Dick is below, but yours should look nicer!

DisplayWordFrequency
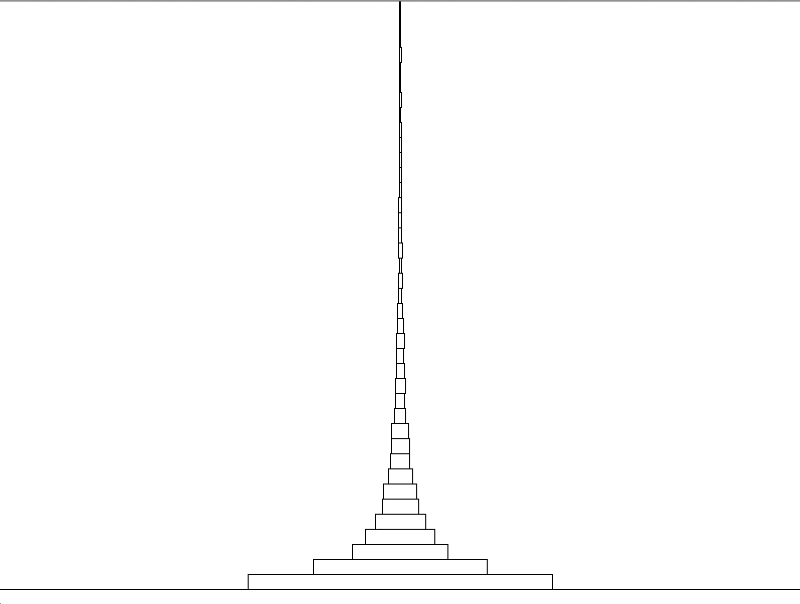
This MonoGame function will generate a visualization of the relationship between word frequency and numbers of words with those frequencies using the contents of wordfrequency.txt. The nature of this visualization is up to the group, but it should capture the rather interesting correlation between these two properties in a body of text.
My example is not the most visually pleasing or creative, but you can use it as a starting point. In this graph, I depict blocks whose widths along the x-axis represent the number of words of that frequency. The block position along the y-axis represents the word frequency itself. As you can see, there are many, many words that have a frequency of one, less than half that number of words with a frequency of two, even fewer with a frequency of three, and so on.
Consider other, better ways you might depict this relationship for extra credit.

The next step is to create the extract_words.py script, which will generate the three text files listed above. Each of these will in turn be used on the visualization portions of the assignment.
You will submit the following in the folder group_yourgroupnumber_assignment3:
Zip this folder and submit via Canvas.