Project Description
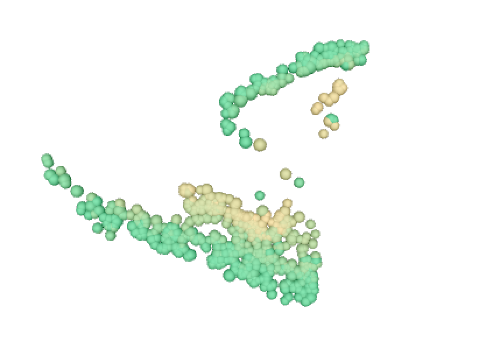
This project explores data parsing and visualization in either Three.js or MonoGame. This is an individual assignment and completely optional. If you choose to complete it, it will replace your lowest project grade. Individuals will take XML or JSON data to create visual representations of, and interfaces for, that data in a web browser using Three.js or an applet using Processing. This project will also incorporate animation and interactivity.
Basic Requirements
You will take a data set and import it into either MonoGame or Three.js to visualize the data. This data can be visualized using traditional graph methods, or you can do something more unique with your representation. That said, you will need to visualize at least three dimensions of data (i.e. the data set will contain at least three variables that have some relationship). The details of how you choose to represent this data are up to you (such as whether to include textual labels etc), but you should justify your reasoning in the report. Functionality requirements are:
- At least three axes of data taken from a XML or JSON file (CSV files also allowed, but we did not discuss how to import them into Three.js).
- 3D meshes for representing data points.
- Phong shading model applied to the 3D meshes along with any necessary lights.
- Keyboard and mouse interactivity.
- Animations on the 3D meshes.
Note that you will be graded on the quality/readablity if your visualization, so while you have a lot of freedom in how you want to approach the above functionality, you should consider how easy it is to understand and use your visualization system. Thus you will likely have to normalize your data/modify your transformations in regards to that data to make the visualization clearer/more meaningful.
Extra Credit
All assignments have possible extensions that you might consider adding to your scene for extra credit. Note that if the submission is well beyond the scope of the assignment, we will consider giving extra credit even if the features implemented are not ones suggested below. All requirements of the assignment must be met before credit for this will be given.
Multiple data representations (3 points)
Allow the user to change how the data is represented (or an additonal view that provides details not visible from the main visualization).
Getting Started
Start by finding interesting data sets you might want to work with in either JSON or XML format (CSV data is also allowed). Small, accessible CSV datasets are available
here for experimenting with import, but you can also look for larger data sets on
data.gov. These data sets -- especially in XML -- might require some cleaning, though, so account for that when scheduling development time.
Project Submission
You will submit the following in the folder youreid_assignment8:
- A MonoGame folder with project youreid_assignment8 and the necessary dataset OR a Three.js folder with file youreid_assignment8.html and the necessary dataset, as well as additional scripts your project requires
- A README text file that tells us how to run your visualizations as well as any controls (keyboard and mouse inputs)
- Any additional classes/media files required for the project
- A project description text file, assignment8_description.txt, that summarizes the visualization functionalities and implementations, what the included classes/scripts do, and any unexpected challenges. This is mostly a rehash of the progress report but from the position of what you accomplished rather than what you were planning.
Zip this folder and submit via Canvas.
