|
Visualization of molecules, and their behavior over time helps in scientific
exploration, discovery and a means of confirming what we know about them.
Simulations are performed at the molecular level with the increase in resolution
of data sets and parallel computing machines. At CVC, we have many visualization
tools developed for interactive browsing of large data sets.
Proteins, made up of atoms, are inherently non planar shapes. There are many
models which are used to represent them, including
- Ball and stick model
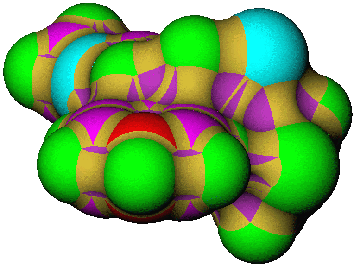
- Union of balls model
- Solvent accessible surface
- Solvent contact surface
- Rolling solvent model
Apart from surfaces, we are also interested in visualization of fields
including interactions, electron density and electrostatic potentials. These
volumetric functions are visualized in a variety of software tools developed at
CCV, which include ray tracing, hardware based texture mapped rendering and
hierarchical splatting.
Some of the visualization methods we have to represent and render large data
sets are
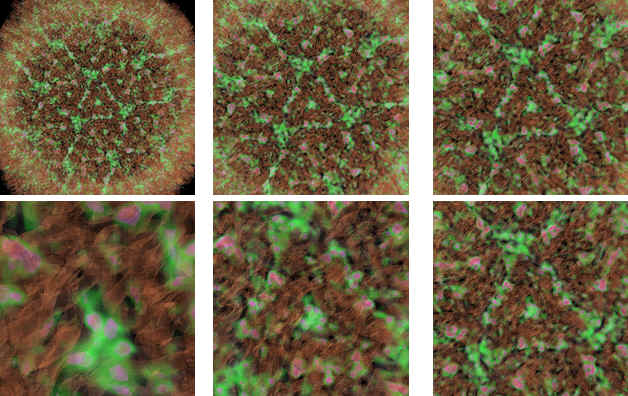
- Imposter model for large ball and stick models
 |
 |
| Close up view of the microtubule |
Zoomed out view of the microtubule, rendered on a PC at
interactive speeds |
- Splatting of AMR and higher dimensional data sets
 |
 |
 |
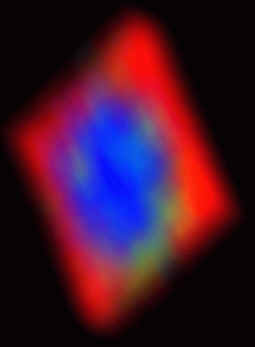
| 5D visualization of interactions |
- Volumetric visualization based on hardware accelerated texture mapping
algorithms

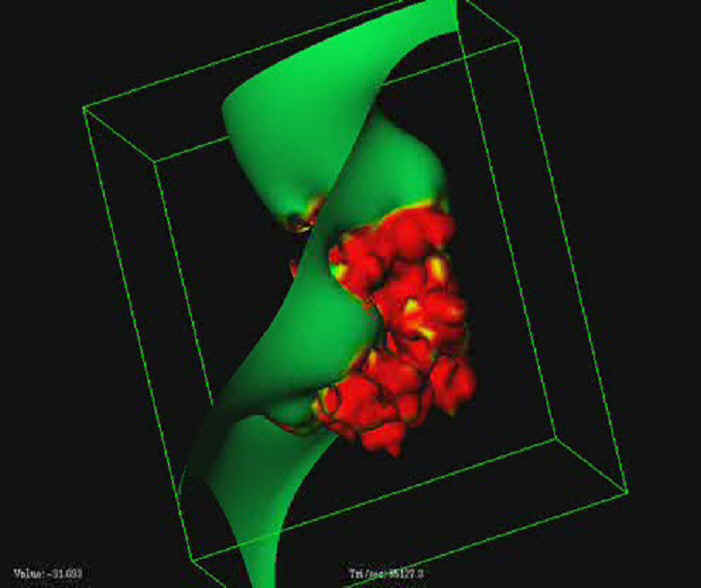
- Multiresolution based isocontouring
- Volumetric ray tracing

- Algbraic functional representation for curves and surfaces of molecules

- Client server rover based model for large data exploration
This is useful to visualize very large models of volumetric functions,
allowing the user to explore regions of interest in high resolution, guided
by a low resolution rendering of the same data set in a different
synchronized view.
|