|
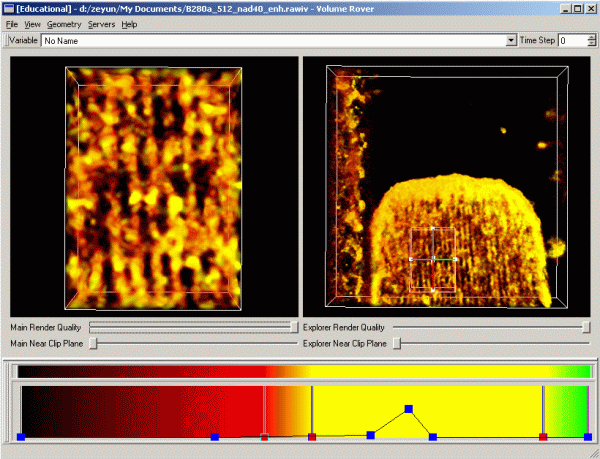
The volume-rendering client can act as a 3D roving microscope,
allowing users to visualize data that is too large to fit on
a single machine. The graphical user interface allows for
interactive visual selection of transfer function and
isosurface. The user interface also allows the user to
move and resize the sub-volume window. The data within
the sub-window is then transmitted by the server to the
client computer, and displayed interactively using fast
texture based volume rendering that can be combined with
rendered geometry. The rover connects to a data server that
contains large datasets. The server can extract and resample
sub-volumes of different sizes, which are then transmitted
to the client for visualization.

Fig. 1 Example of Volume Rover
|