

Next: Pop-out and line
Up: Long Range Connections
Previous: Long Range Connections
The cells are orientation selective and spatially organized according
to a two-dimensional model orientation preference map
[37,61]; see Fig. 10.
In addition to the center-surround connectivity (discussed above),
each cell has 10 long-range connections, chosen in the range between
25-50 lattice constants which connect it only with cells of similar
orientation preference (difference in preferred orientation less than
 ) reproducing the pattern of long range clustered connections
found in physiological studies
[14,28,29]. In these
simulations we assume that the long-range connections between cells
with similar orientations are excitatory (but see the following
section).
 |
 |
| Activity in neuronal array |
Cross-correlation functions for different separations |
Figure 10:
(click on the image to view a larger version)
Activity in neuronal array. Shown is the array of
 cells where the gray-level of each pixel corresponds to
the preferred orientation of the respective cell (lightest gray:
horizontal, light gray:
  , dark gray:
  , black:
  ).
White pixels represent spiking cells. At this time, most of the
activity is in regions with preferred orientation of about
  .
.
External input is modeled independently for each cell as a Poisson
process of excitatory voltage pulses of size  , arriving at a mean
rate which depends on the phase difference between the stimulus
orientation and the cell's preferred orientation. The simulations were
performed under two conditions:
-
A control, no-stimulus situation, in which the rate of the Poisson
process received by each cell is the same (this could also be
interpreted as spontaneous activity or as a noisy visual stimulus
exciting all orientation cells alike).
-
A simulation with 2 stimuli of different orientations. All cells in
the left half plane received a stimulus with a specific orientation,
while cells in the right half plane received a stimulus with an
orthogonal orientation.
In particular, we compare the strength of synchronization in the
stimulus condition between cells that receive the same stimulus (both
in the right half plane or both in the left half plane) versus cells
which receive mutually orthogonal stimuli. Figure 10, left
shows a snapshot of the activity in the 2-dimensional array,
superimposed on the underlying orientation column structure.
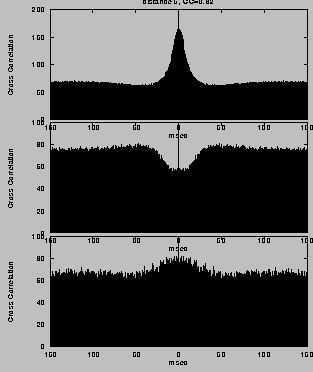
For mutually excitatory pairs of cells, the cross-correlations show a
`castle' [35] with a width of about 10-20 msec and
centered at zero time offset (Fig. 5, top right). The
cross-correlation function between model neurons at larger distance
shows a weaker, slower ``hill'' (Fig. 5, bottom right). For
mutually inhibitory cells the correlation function is characterized by
a dip that rises to the coincidence level at longer times
(Fig. 5, center right).
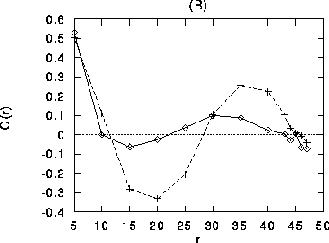
Figure 11:
(click on the image to view a larger version)
Correlation coefficient as a function of distance (in lattice
constants) All curves are averaged over populations of
neurons. (A) Homogeneous stimulation. Diamonds: correlation
coefficient between cells of like orientation ( ), crosses: between cells of orthogonal orientation
(
 ;
;  ). For
distances larger than about 35 lattice constants, correlations
between cells with common orientations (diamonds) become stronger than
those between orthogonal orientations. (B) Differential stimulation.
Diamonds: correlation coefficient between cells receiving stimulation
with different orientation, crosses: correlation coefficient between
cells receiving stimulation with the same orientation. Both curves in
(B) are averaged over cells with all orientations. Note that for r
between 30 and 45 (about the range of long-distance connections),
pairs of cells receiving input with similar orientation are more
strongly correlated than cells receiving input with orthogonal
orientations, even if the members of the pair have with different
preferred orientation.
We quantify the strength of synchronization by the contribution
coefficient of the cross-correlation [51]. This
quantity measures the number of coincidences above chance level and is
computed as the area of the cross-correlation above the asymptote
divided by the total number of spikes. Both in the control case as
well as in the simulation with oriented external input
(Fig. 11), the contribution coefficient exhibits a spatial
oscillation, with largest values at small distances (for neighboring
cells), then becoming negative at about 15-30 lattice units
(indicating anti-correlated activity), and then becoming positive
again at the typical distances of the long range clustered connections
(35-45 lattice constants).
In the control situation, the contribution coefficient at large
distances is larger for similar vs. orthogonal orientations. For the
2-orientation stimuli, the contribution coefficient of cells with the
same separation (30-45) is larger for cells belonging to the same half
plane than for cells across the boundary between the two half s of the
system that receive different stimuli (even if the later have the
same orientation preference).
We have also computed the effect of stimulus-dependent synchronization
on the basis of the LFP variables. We have computed the mean LFP
cross-correlations between two recording sites, stimulated either by
the same or by different gratings, within the same distance between
each pair of sites. As shown in Figure 12, the correlation
between cells receiving the same input is significantly stronger than
that between cells that receive different inputs. One should notice
that this effect is stimulus dependent and can not be explained by the
simple fact that connected cells synchronize
[31]. In fact, the degree of correlation between
two given cells depends their stimulation and is not only a function
of the connectivity.

Figure 12:
Cross-correlation functions of local field potentials.
The dotted curve is between populations of cells with the same preferred
orientation and the full line is between different preferred
orientations.
The mechanism responsible for stimulus dependent synchronization is the following:
-
Nearby cells are partially synchronized due to the short range
excitatory connections, independent of their orientation
preference. However cells whose preferred orientation equals that of
their respective stimulus fire at a higher rate. Non-optimally
oriented cells spike less, but when they do, they are in synchrony
with their neighboring cells of optimal orientation preference.
-
Cells at larger distances excite each other only if they have the same
orientation preference. Therefore, if two cells separated by a
distance in the range of the clustered connections receive the
same stimulus (even if they are not optimally tuned themselves), they
indirectly synchronize via the intermediate synchronization with their
optimally tuned neighboring cells.
- For cells at similar distances that receive orthogonal
stimuli, the synchronization link is less effective, since the
optimally oriented cells in their vicinity have no direct connections.
Thus we find stimulus-dependent synchronization for cells in the range
of the clustered connections. In accordance with recent experimental
findings [16] and with other modeling
work [45], we find that the degree of
synchronization is higher when cells are excited with the same
orientation. Synchronization is strong between nearby cells
(independent of orientation preference) and there is a clear tendency
for synchronization between cells with the same orientation preference
separated by larger distances. We find that this result does not
require models based on abstract phase oscillators with
amplitude-dependent interactions, as in [45], but
can be obtained in the more biologically plausible framework of
populations of integrate-and-fire neurons.


Next: Pop-out and line
Up: Long Range Connections
Previous: Long Range Connections
 ) reproducing the pattern of long range clustered connections
found in physiological studies
[14,28,29]. In these
simulations we assume that the long-range connections between cells
with similar orientations are excitatory (but see the following
section).


 cells where the gray-level of each pixel corresponds to
the preferred orientation of the respective cell (lightest gray:
horizontal, light gray:
  , dark gray:
  , black:
  ).
White pixels represent spiking cells. At this time, most of the
activity is in regions with preferred orientation of about
  .
.  , arriving at a mean
rate which depends on the phase difference between the stimulus
orientation and the cell's preferred orientation. The simulations were
performed under two conditions:


 ), crosses: between cells of orthogonal orientation
(
 ;
;  ). For
distances larger than about 35 lattice constants, correlations
between cells with common orientations (diamonds) become stronger than
those between orthogonal orientations. (B) Differential stimulation.
Diamonds: correlation coefficient between cells receiving stimulation
with different orientation, crosses: correlation coefficient between
cells receiving stimulation with the same orientation. Both curves in
(B) are averaged over cells with all orientations. Note that for r
between 30 and 45 (about the range of long-distance connections),
pairs of cells receiving input with similar orientation are more
strongly correlated than cells receiving input with orthogonal
orientations, even if the members of the pair have with different
preferred orientation.