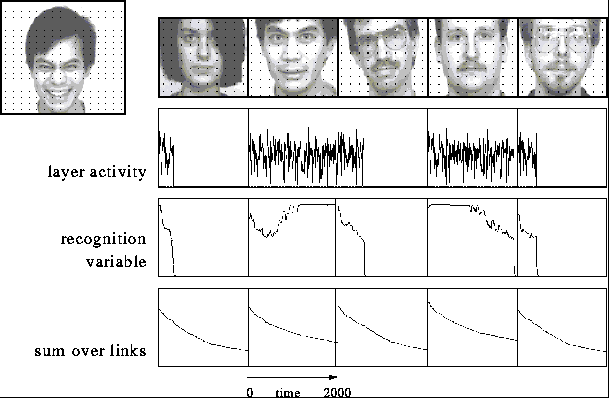


Figure 8 shows two recognition examples, one using a test face rotated in depth and the other using a face with very different expression. In both cases the gallery contains five models. Due to the tight connections between the models, the layer activities show the same variations and differ only very little in intensity. This small difference is averaged over time and amplified by the recognition dynamics that rules out one model after the other until the correct one survives. The examples were monitored for 2000 units of simulation time. An attention phase of 1000 time units had been applied before, but is not shown here. The second recognition task was obviously harder than the first. The sum over the links of the connectivity matrices was even higher for the fourth model than for the correct one. This is a case where the DLM is actually required to stabilize the running blob alignment and recognize the correct model. In many other cases the correct face can be recognized without modifying the connectivity matrix.

Figure 8: (click on the image to view a larger version) Simulation examples of DLM
recognition. The test images are shown on the left with 16 17
neurons indicated by black dots. The models have 10
 10 neurons
and are aligned with each other. The respective total layer
activities, i.e., the sum over all neurons of one model, are shown in
the upper graphs. The most similar model is usually slightly more
active than the others. On that basis the models compete against
each other, and eventually the correct one survives, as indicated by
the recognition variable. The sum over all links of each connection
matrix is shown in the lower graphs. It gives an impression of the
extent to which the matrices self-organize before the recognition
decision is made.
Recognition rates for galleries of 20, 50, and 111 models are given in Table 3. As is already known from previous work [9], recognition of depth-rotated faces is in general less reliable than, for instance, recognition of faces with an altered expression (the examples in Figure 8 are not typical in this respect). It is interesting to consider recognition times. Although they vary significantly, a general tendency is noticeable: Firstly, more difficult tasks take more time, i.e., recognition time is correlated with error rate. This is also known from psychophysical experiments (see for example [3,6]). Secondly, incorrect recognition takes much more time than correct recognition. Recognition time does not depend very much on the size of the gallery.

Table 3: Recognition results against a
gallery of 20, 50, and 111 neutral frontal views. Recognition time
(with two iterations of the differential equations per time unit) is
the time required until all but one models are ruled out by the
winner-take-all mechanism.


