Section 2.1 Opening Remarks
¶Unit 2.1.1 Launch
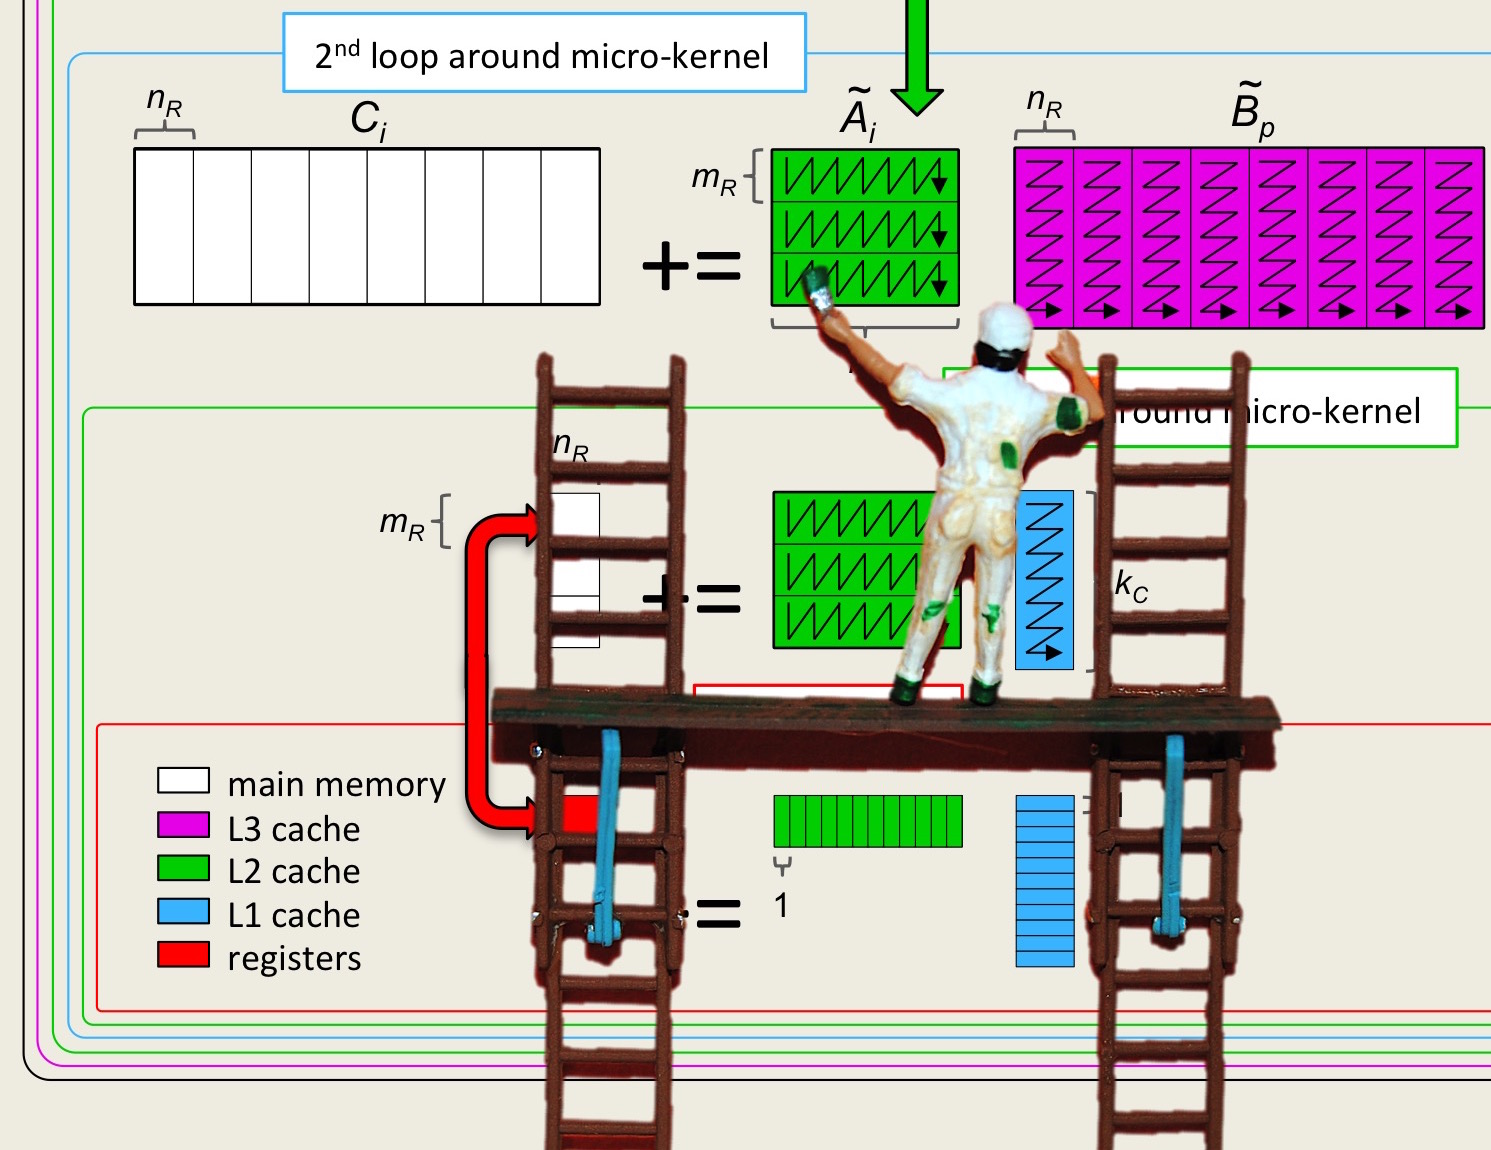
¶At the end of the last Week, you used the Live Script in Assignments/Week2/C/data/Plot_All_Outer.mlx to compare and contrast the performance of many of the algorithms that use the I, J, and P loop as the outer-most loop, yielding the graph

In that Live Script, change the ( 0 ) in
if ( 0 )
  plot( data(:,1), data(:,3), 'MarkerSize', 8, 'LineWidth', 1, ...
       'LineStyle', '-', 'DisplayName', 'Ref', 'Color', plot_colors( 1,: ) );
end
to ( 1 ) and regenerate the graph. What do you observe?
Solution
 Left: Performance for different choices of the outer loop, calling the BLIS typed interface. Right: Same data, but now with the performance of the reference implementation added.
Unit 2.1.2 Outline Week 2
¶Under construction.
Unit 2.1.3 What you should know
¶Under construction